Absolute vs Relative Retention: Which Number to Trust
Absolute vs relative audience retention on YouTube: read the cliff, use typical retention correctly, and fix your first 30 seconds before chasing a benchmark.

10 min readUpdated
In this guide
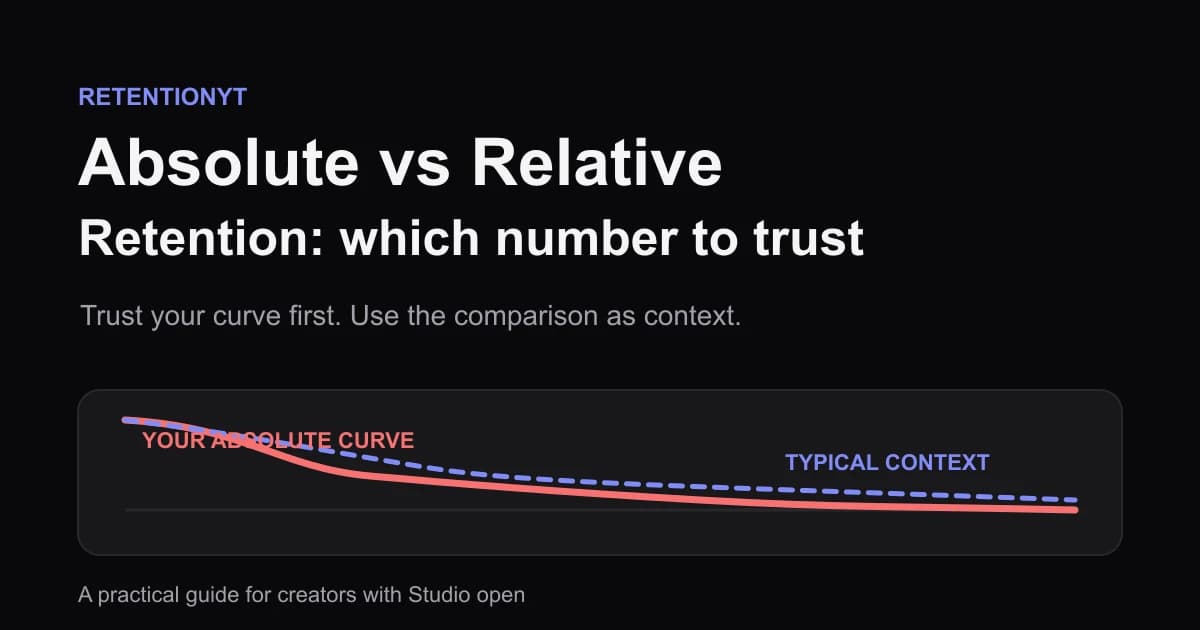
Absolute retention is the curve for this video; relative retention is the comparison you use for context. If your line falls from 100% to 54% by 0:08, a typical line near 55% does not make the hook healthy. Treat that as an illustrative reading, fix the first 30 seconds, and only then ask whether the new curve beats comparable uploads.

What Absolute vs Relative Retention actually is (and what it is not)
Use this working rule of thumb while you have Studio open: absolute retention is the percentage of this video’s starters still watching at a timestamp. Relative retention is a comparison against similar videos or a typical baseline. The first line tells you what happened on your upload; the second helps you judge whether the shape is unusual.
Neither line is a universal grade. A relative position near the middle does not mean your video is healthy, and a low relative position does not tell you which sentence caused the loss. Start with the absolute curve, name the timestamp, and connect that moment to the spoken line, visual, or edit on screen.
| Line to read | Question it answers | Best first action | What it cannot prove |
|---|---|---|---|
| Absolute retention | Where are viewers still present on this upload? | Mark the first sharp fall and inspect that moment. | It cannot explain reach or demand by itself. |
| Relative or typical comparison | How does this shape sit beside similar videos? | Use it after you identify your own curve’s problem. | It cannot pardon an opening cliff or guarantee more views. |
| Average percentage viewed | How much of the video was watched on average? | Use it as a summary, then return to the curve. | It cannot locate the exact line that lost viewers. |
Absolute is your diagnostic map; relative is the context layer. If the lines disagree, start with the timestamped evidence from your own curve.

Why this shows up in YouTube Studio
YouTube’s current help page describes a video report called Key moments for audience retention. It says that the report shows how well different moments held viewers’ attention and that typical retention can compare your 10 latest videos of similar length. That is the useful product behaviour to anchor on: the report gives you a moment-by-moment view and a comparison frame, not permission to ignore a drop.
The report sits in the Videos section of YouTube Analytics. Sign in, open Analytics, select Content, and choose the video report exposing retention moments. Read the current labels instead of following an old tutorial.
A separate YouTube Help reach guide, accessed August 2026 currently documents the route to a selected video’s Analytics and Reach reports, along with reach metrics. It does not currently display the brief’s expected audience-retention title, so do not cite that page as proof of the two-line retention definition. The locked page that does describe typical retention is YouTube’s current content-performance guide, accessed August 2026.
When you read the chart, ask three questions: where is the first non-routine drop, what was promised before it, and does the same moment sit above or below the comparison line? For a second pass on curve shapes, use RetentionYT’s guide to reading a YouTube retention graph; the manual method here needs no account.
Worked example 1: the failure
Suppose an illustrative 8-minute upload begins at 100% and falls to 54% at 0:08. The typical comparison is 55% at the same timestamp. The two lines look almost identical, which is exactly why this case is easy to misread.
| Timestamp | Illustrative absolute | Illustrative typical | What you should notice |
|---|---|---|---|
| 0:00 | 100% | 100% | Everyone in this example has just started. |
| 0:08 | 54% | 55% | A 46-point opening loss is still the first repair target. |
| 0:30 | 47% | 49% | The opening damage has carried forward. |
| 4:00 | 31% | 33% | A later comparison does not erase the early cliff. |
| 8:00 | 19% | 20% | The final level is less useful than the first cause. |

These are illustrative numbers, not a YouTube benchmark. The failure is not that the video sits one point below typical. The failure is the unedited opening: a welcome, a logo, and a promise that arrives after the viewer has already waited eight seconds.
A sentence such as “In this video, I’m going to explain a few things about retention” spends the opening without a concrete reason to stay. Replay 0:08, name what changed, and remove a slow reveal or move the promised result earlier. Keep the pattern labelled illustrative; do not turn it into a niche-wide average.
Worked example 2: the fix
Use the same illustrative starting pattern, but rewrite the opening around the viewer’s immediate question. At 0:00, show the retention curve with the cliff highlighted. At 0:02, say what the viewer will be able to diagnose. At 0:08, name the first repair instead of beginning with channel history. At 0:20, preview the before-and-after edit.
This does not guarantee a particular percentage. It changes the test. You can now compare the next upload’s absolute curve at 0:02, 0:08, 0:20, and 0:30 with the prior upload, while using typical retention only as a reference. If the 0:08 cliff becomes a smoother slope, you have learned something actionable even if the overall comparison line is unchanged.
The first-30-seconds retention guide is a useful companion for breaking the opening into smaller jobs. Borrow its discipline, not its numbers: write the promise, confirm it quickly, establish the stakes, and preview the payoff. Your own curve remains the test.
Keep the comparison honest: compare similar lengths when available, and label a hand-drawn line “illustrative rehearsal, not a published benchmark.”
How to check this in YouTube Studio (step by step)
- Open YouTube Studio and select the upload you want to diagnose. Work on one video at a time so the timestamp, transcript, and edit stay aligned.
- Open the video’s Analytics view and locate the audience-retention report. The current YouTube description calls the video report Key moments for audience retention.
- Move across the curve and write down the first obvious cliff, not merely the lowest point at the end. Record the timestamp to the nearest second, such as 0:08, and the percentage shown there.
- Replay the matching seconds in the video. Note the exact spoken sentence, visual change, pause, ad or sponsor transition, and any moment where the title promise is postponed.
- Use the typical comparison only after your own timestamp is written down. Compare the same moment and similar-length context; do not compare an opening timestamp with a late-video average.
- Classify the shape as a cliff, slow bleed, hold, or spike. That label is a working diagnosis, not a platform score. A cliff usually deserves an edit before a gradual decline does.
- Choose one change for the next upload. Shorten the setup, show the result earlier, replace a generic welcome, or align the first visual with the title. Do not change five variables and lose the lesson.
- Recheck the next upload using the same timestamps. Keep a small log with the date, video, opening wording, first cliff, comparison note, and what you changed.

The manual loop is enough: read, replay, rewrite, and compare. RetentionYT’s viewer retention checker can shorten pre-production, but it should complement Studio evidence.
The trap
The trap is benchmarking before diagnosing. You see a relative line that sits near typical, decide the opening is acceptable, and spend the afternoon polishing a thumbnail or adding a mid-roll pattern interrupt. The graph already told you where the first viewers left; the comparison only told you that similar videos may have a similar problem.
The second trap is treating one percentage as the whole story. A line at 54% means something different at 0:08 than at 4:00. Always pair the percentage with the timestamp, then connect it to the words and pictures the viewer saw at that moment.

The trap
The move
Do not confuse retention with every other performance report. The current content-performance page separately lists views, average view duration, average percentage viewed, watch time, impressions, and click-through rate. Those measures answer different questions. If views are low, inspect reach and packaging as well; a healthy curve cannot create impressions that never happened.
What to do in the next upload
Before you record, write a one-line promise that can be understood without channel history. Then draft the first 30 seconds as four jobs: show the problem, confirm the promise, state why it matters, and preview the payoff. Read it aloud and remove any sentence that delays the first useful proof.
After publishing, do not chase an invented target. Capture the curve when your Studio report has enough information to make the shape readable, and label your private notes with the date. Compare your own upload with a similar-length context when available, but keep the primary decision tied to the absolute timestamp.
Use this checklist on the next upload:
- The first visual makes the title promise concrete by 0:02.
- The spoken promise is clear by 0:08.
- The opening has no generic welcome or logo delay.
- The first proof or payoff preview arrives before 0:20.
- I have named the first sentence I want viewers to understand.
- I will record the first cliff timestamp and percentage.
- I will compare the same timestamp with typical retention only after reading my curve.
- I will change one opening variable before the next upload.
- I will write the date and version of the opening in my test log.
End with one edit you can make. If the curve drops at 0:08, fix what the viewer saw and heard there. Re-test before blaming the comparison line.
Where RetentionYT fits
Manual method works alone. Product shortens the loop. RetentionYT can help you pressure-test a script before recording, while YouTube Studio remains the place to inspect the published video’s actual audience response.
Read the absolute curve as evidence, and use the relative line as context.
Frequently asked questions
- What is relative retention on YouTube?
- Relative retention is a comparison against similar videos, used as a context line rather than a pass or fail grade. A strong relative position can still sit beside a sharp early loss on your own video. Use it to ask whether your pattern is unusual for comparable uploads, then inspect the absolute curve to choose the edit.
- What is absolute retention?
- Absolute retention is the share of viewers who started this video and remain at each moment. Read it as your video’s own curve: the height at 0:08 tells you how many starters are still watching then. It is the direct signal for locating a cliff, a steady bleed, a hold, or a later spike.
- Which should I optimise?
- Optimise the absolute curve first, especially the opening 30 seconds, because it shows where viewers leave on this upload. Use typical retention afterward as context: YouTube says the report can compare your 10 latest videos of similar length. A benchmark can tell you whether a pattern is common, but it cannot repair your hook.
- Why is my relative retention high but views are low?
- A high relative position can coexist with low views because relative retention describes the viewing pattern, not demand, impressions, or click-through rate. Your niche may have a similar early drop, or the video may be shown to too few people. Check the absolute curve, packaging, and reach context separately instead of treating one line as a traffic forecast.
- Where is typical retention in Studio?
- In the current YouTube Help description, typical retention appears with the Key moments for audience retention report for videos. That report is described under Analytics and can compare your 10 latest videos of similar length. If your Studio layout differs, use the current report labels rather than relying on an old screenshot or an assumed menu name.
- How do I apply “Absolute vs Relative Retention” on my next upload?
- After the upload has enough viewing data, mark the first obvious absolute drop, compare the same timestamp with typical retention, and write one hypothesis about the opening. For the next upload, promise the result sooner, remove the slowest setup, and re-check the curve. Label any numbers in your notes as illustrative unless they came from your own Studio export.
- Where in YouTube Studio do I check “Absolute vs Relative Retention”?
- Open YouTube Studio, select Analytics, choose the Content tab, and open the video’s audience-retention report when it is available. The locked YouTube Help source describes the video report as Key moments for audience retention and places it in the Videos section. Look for the comparison control in that report, then hover the same timestamps.
- What is the most common mistake with “Absolute vs Relative Retention”?
- The common mistake is using a typical or relative comparison line to excuse an early absolute cliff. A peer benchmark can show that other similar videos also lose viewers, but it does not make your opening effective. Name the timestamp, replay the first sentence and visual, and fix the clearest promise mismatch before polishing the middle.
Give your next script a second look
Paste a script into RetentionYT for suggestions on your hook, pacing, and structure. Choose the edits that serve your video, then check audience behavior in YouTube Analytics after publishing.
Get retention tips in your inbox
Occasional, practical emails on hooks, pacing, and retention. No spam.
Related posts
How to Benchmark Retention Against Your Own Length Band
A YouTube retention benchmark by video length should start with your own channel: compare the last 8 videos in a similar length band, not a global chart.
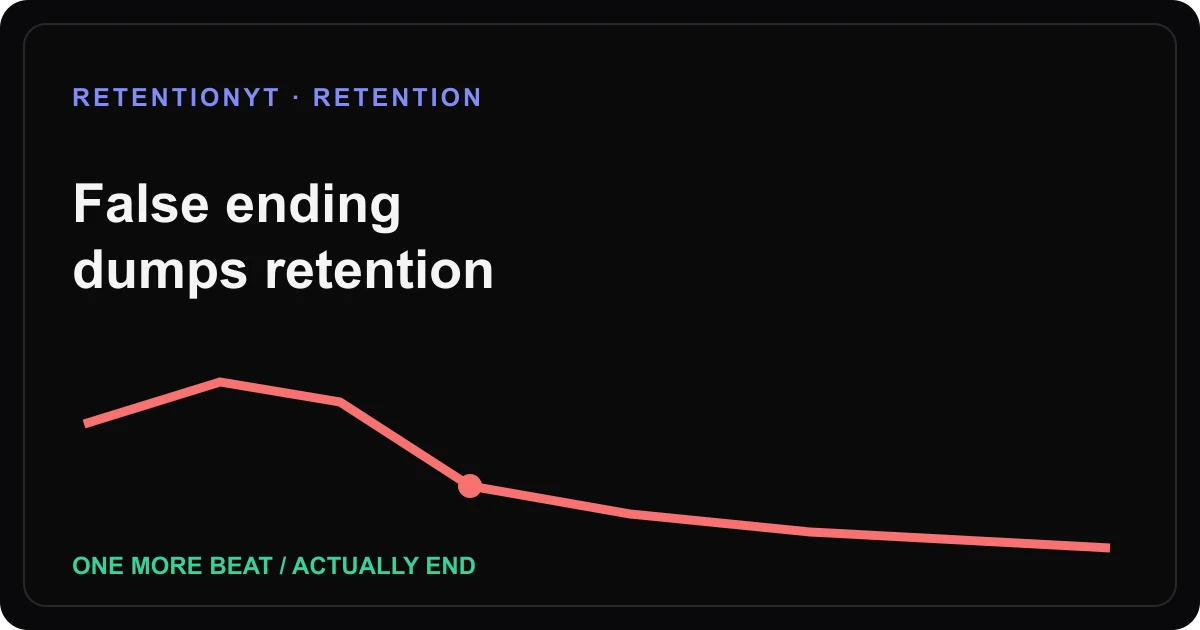
False Ending That Dumps Retention
Fix the YouTube fake-out ending that triggers a retention drop: mark the cue, read the transcript, and choose one more beat or actually end.
How to Handle a Spike: Clone the Line, Don't Just Smile at Analytics
When YouTube retention spikes, transcribe the exact 8 seconds, explain why viewers replayed it, and turn the line into a hook, thumbnail noun, or Short.