How to Read Your YouTube Retention Graph (and Fix What It Shows)
Your YouTube retention graph is a line-by-line map of where viewers left. Learn to read every dip, cliff, and spike — and fix each one with concrete script and edit techniques.

35 min read
Your retention graph is a map that points at the exact line in your script that lost each viewer. Once you learn to read it, you stop guessing why videos underperform — and you start editing the two or three seconds that actually matter.
6,900 words
Most creators look at their YouTube retention graph the way a driver looks at a check-engine light: they know something is wrong, they feel a small wave of dread, and then they close the tab and hope the next video performs better. That is the most expensive habit in this platform. The retention curve is not a scoreboard — it is a diagnostic instrument that tells you, second by second, which line of your script pushed a viewer to close the tab.
Once you can read it, three things change. You stop blaming the algorithm for videos that quietly lost half their audience in the first fifteen seconds. You stop guessing what to change in the next video and start rewriting the exact section that failed in the last one. And you begin to notice a pattern that only shows up when you compare graphs across dozens of uploads: every underperforming video fails in one of about six recognizable ways, and each way has a fix.
This guide is the field manual we wish every creator had after their first hundred uploads. We will walk through how to open the graph, what its shape actually means, how YouTube reads that shape to rank you, and — most importantly — what to do at the script and edit level for each pattern you will see. If you want to shortcut the graph-reading step entirely and go straight to per-scene diagnostics on your own uploads, RetentionYT parses your graph and your transcript together so you can see which sentences correspond to which dips.
Who this article is for
Creators who already have 5–500 uploads and access to YouTube Studio Analytics. Everything here applies whether you make long-form essays, tutorials, vlogs, gaming content, or short-form (though Shorts retention behaves slightly differently — noted where relevant).
What audience retention really measures
Audience retention is the percentage of a video that the average viewer watches at any given point in the timeline. It is not a single number — it is a curve. YouTube calculates it by taking every play, every rewind, and every drop-off, then averaging them into a normalized line where 0:00 is 100% and the shape of the descent tells the story.
Two headline numbers derive from this curve. Average view duration (AVD) is the mean watch time across all views, expressed in minutes and seconds. Average percentage viewed (APV, sometimes called retention rate or watch percentage) is that same figure expressed as a percentage of video length. Both matter, but they answer different questions. AVD is a ranking signal — an absolute quantity YouTube feeds into recommendation. APV is a diagnostic ratio you use to compare videos of different lengths on the same channel.
The graph itself contains four types of movement you need to learn to recognize:
- Gradual decline — the normal, slow slope. Every video has one. Even the best videos lose viewers.
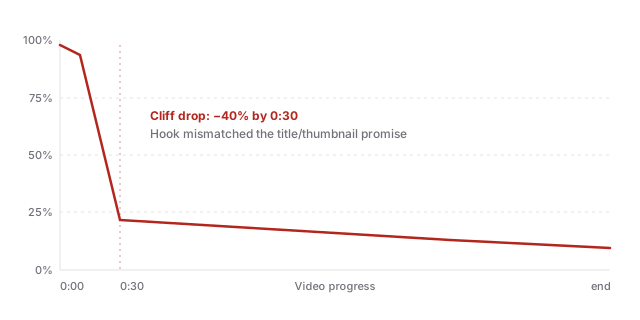
- Cliff drops — vertical or near-vertical falls, usually within a few seconds. These are almost always caused by a specific moment: a wrong turn in the script, an intro that broke the promise of the title, or a jump-cut that felt jarring.
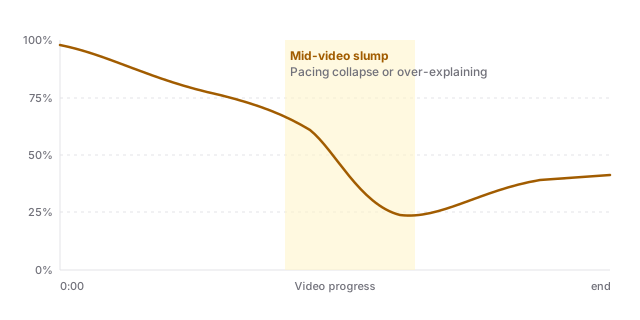
- Slumps — extended shallow dips over 20–90 seconds. These signal pacing problems: over-explaining, tangents, or missing pattern interrupts.
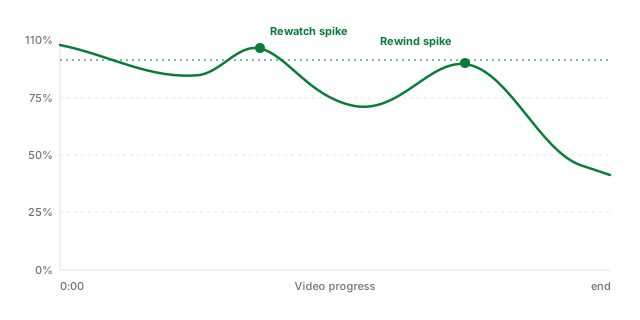
- Spikes — rises above the surrounding line. When the graph goes up, it means viewers rewound to rewatch. Spikes are your gold — study them and replicate what triggered them.
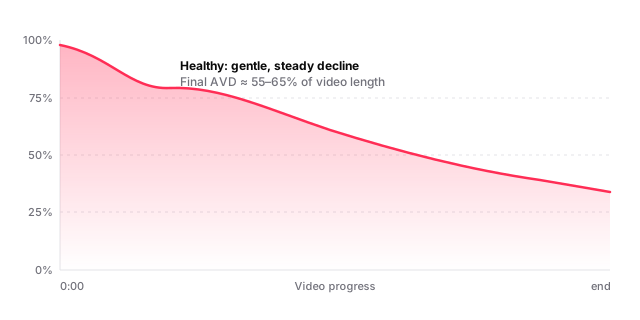
One subtlety trips up new creators: the y-axis is not literal. A curve that plateaus at 60% does not mean 60% of viewers are still watching at that timestamp; it means the average moment of the video is being watched by 60% of the original audience once you account for skips, rewinds, and re-entries. If that sounds abstract, it is — but the shape is still what matters, not the math. Learn to read shapes.
It is also useful to understand what retention does not capture. It does not tell you whether a viewer laughed, agreed, disagreed, subscribed, or shared. It does not distinguish between a viewer who left because they were bored and one who left because their phone rang. It does not tell you why someone rewound — only that they did. This is why retention should always be paired with a second signal (comments, engagement rate, or a scripted A/B change) before you draw firm conclusions. A dip alone is a hypothesis; a dip that shows up on every video in the same spot is a diagnosis.
Two more terms are worth learning because YouTube Studio uses them inconsistently across screens. Absolute audience retention shows the percentage of viewers watching each moment of your specific video. Relative audience retention compares your video's retention to that of other videos of similar length across the platform. Absolute is what you use to fix your own video. Relative is what you use to argue with yourself about whether your content is genuinely above average or just feels that way. Both are visible in the Engagement tab, but Absolute is where the diagnostic work happens.
How YouTube uses retention to rank videos
The recommendation system is often described as a black box, but its retention behavior is one of the most consistently observed patterns across creator studies, patent filings, and the platform's own developer talks. The short version: YouTube optimizes for viewer satisfaction, and viewer satisfaction is inferred primarily from three signals — click-through rate, average view duration, and session watch time.
Retention feeds two of the three directly. AVD is retention expressed in absolute seconds. Session watch time — the total time a viewer spends on YouTube after your video, whether on your channel or elsewhere — depends on whether your video ended in a way that made them want to keep watching, which is itself a retention story. Even CTR is indirectly downstream, because videos with poor retention are shown to fewer people over time, which lowers absolute impressions and click volume.
What this means in practice is that retention compounds. A video with 55% AVD at launch will be tested against a small audience, perform well, get pushed to a larger audience, perform well again, and cascade through the recommendation graph. A video with 30% AVD gets buried inside 48 hours regardless of how good the thumbnail is. The recommendation system is patient with new videos, but it is not sentimental.
"Retention is the single input that decides whether your video gets a second chance at an audience — or gets quietly turned off."
One nuance worth internalizing: YouTube weighs retention against expected retention for a video of that length and topic. A 25-minute deep dive holding 45% is often ranked more favorably than a 6-minute video holding 55%, because absolute watch time is higher and the platform values sessions. This is why optimal length is not a fixed number — it is a function of how long your specific idea genuinely stays interesting.
Two secondary signals feed into how the recommendation system reads your retention curve, and it's worth understanding them so you don't misdiagnose your own data. The first is impression click-through rate paired with early retention. A video with a strong CTR but a 30-second cliff drop reads to YouTube as clickbait — the thumbnail is doing its job, the content isn't. Over the following days, the algorithm will quietly reduce impressions on the browse and home surfaces where CTR was strong, because the downstream watch-time signal is weak. The second is end-of-video behavior: what viewers do after your video ends. If they click a suggested video (yours or someone else's), YouTube reads that as a strong session signal. If they close the app, it reads as a satisfaction signal but a weaker session one. This is why the last 30 seconds matter almost as much as the first — a strong outro produces the session compounding that turns a good video into a great one.
Finally, retention interacts with Shorts and long-form differently. On Shorts, the equivalent metric is swipe-away rate — the percentage of viewers who swipe past your video within the first three seconds. It is not smoothed into a curve because Shorts are too short for smoothing to matter. Everything in this article about the first 30 seconds compresses down to the first 3 seconds on Shorts. The principles are the same; the surface area is smaller and the margin for error is close to zero.
Reading the retention graph, section by section
Open YouTube Studio, go to Content, click any video, then Analytics → Engagement. Scroll to "Key moments for audience retention." That's your graph. Hover any point to see the exact timestamp and percentage. On desktop you can also use arrow keys to step through it frame by frame; on mobile you tap and hold.
Read the graph in four passes. Do not skip ahead — each pass builds context for the next.
Pass 1 — The intro window (0:00 to 0:30)
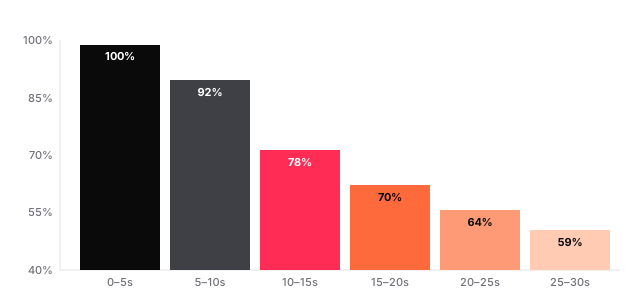
The first 30 seconds always tell the biggest story. On most videos, this window contains between 30% and 60% of your total drop-off. If your curve loses 40 percentage points before the 30-second mark, everything else you do on the rest of the video is fighting from behind. Look specifically at whether the drop is a smooth slope (viewers are gently deciding this is not for them) or a cliff (something specific pushed them out — usually a slow logo intro, a mismatch with the thumbnail, or an opening that took too long to justify why they should stay).
Pass 2 — Cliff detection
Scroll along the entire video and look for any vertical or near-vertical drop of 5 percentage points or more within a 10-second window. Mark each one. Cliffs are your highest-leverage fixes because each one is almost always caused by a single, identifiable element — an ad break, a sponsor read, a transition that took too long, a joke that landed poorly, or a segment that felt off-topic.
Pass 3 — Slumps and pacing valleys
Look for zones where the curve flattens noticeably or dips 3–7 percentage points across a longer stretch — 30 seconds to 2 minutes. Slumps are less dramatic than cliffs but they cost more total watch time because they last longer. The mid-video slump is the most common: creators front-load their strongest material, then relax pacing in the middle third. Viewers, sensing the drop in energy density, drift.
Pass 4 — Spikes and rewatch signals
Spikes are the parts of the graph that go up. They mean viewers rewound to see something twice — a demo, a punchline, a stat, a visual reveal. YouTube's system reads these as high-value moments. Note their timestamps and ask: what was on screen? Whatever it was, that's a template for what your audience actually pays attention to. Do more of it.
Shortcut: line up transcript and graph
Reading a graph in isolation is slow because you have to keep flipping between the timestamp and the actual footage. RetentionYT aligns your transcript to the curve, so each dip is labeled with the exact sentence spoken at that moment. This turns a 40-minute manual audit into a 5-minute review.
Diagnosing where viewers drop off
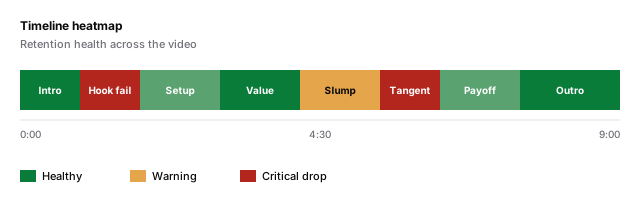
Every drop-off has a cause, and after you audit enough graphs a taxonomy emerges. Below is the pattern library we use internally at RetentionYT. If you learn to name the pattern, you can go straight to the fix.
Pattern A — The slow intro cliff
Shape: sharp drop between 0:03 and 0:20. Cause: logo animation, generic music bed, unrelated small talk ("hey guys, welcome back to the channel, so today…"), or a thumbnail promise that doesn't get delivered until later. Fix: kill the intro. Start the video with the payoff, the question, or the visual result that the title promised. Save the housekeeping for after the first act.
Pattern B — The bait-and-switch cliff
Shape: cliff around 0:30–1:00, coinciding with the moment the topic pivots. Cause: title/thumbnail set up expectation X, but the video is actually about Y. Fix: either rewrite the opening so the connection is obvious within the first 10 seconds, or (more often) change the title/thumbnail to match what the video is really about. Bait is a short-term click hack that destroys long-term retention.
Pattern C — The mid-video slump
Shape: extended shallow dip between 40% and 65% progress. Cause: pacing collapse — usually one of over-explanation, unnecessary context, a poorly placed sponsor read, or lack of pattern interrupts. Fix: cut 20–30% of the middle. Add a visual reset (b-roll change, on-screen text, tone shift, or a moment of tension) every 25–35 seconds.
Pattern D — The tangent drop
Shape: a cliff mid-video followed by a slower recovery. Cause: you went on a personal aside, an inside joke, or a topic that only some of your audience cares about. Fix: cut it, or move it to the end as a bonus segment. If the aside is core to your identity, keep it — but make it earn its keep with a promise like "stick around for the weirdest email I got this month."
Pattern E — The premature outro
Shape: sharp drop in the last 10–15%, before the actual end. Cause: viewers sensed the video was ending (energy drop, "so, in conclusion…", or a visual outro cue) and left. Fix: front-load the summary, save the strongest visual or line for the last 10 seconds, and use end screens strategically without signaling "this is over" too early.
Pattern F — The sponsor/ad break drop
Shape: cliff drop coinciding with a mid-roll ad or sponsor read. Cause: viewers hit their tolerance ceiling for interruption. Fix: shorten sponsor reads to 30–45 seconds, place them after a completion signal (an emotional peak or a solved problem), and script a bridge sentence that promises what comes next.
Warning: don't confuse a spike with a drop
Some creators panic when they see any sharp movement, but a sharp rise (spike) is the opposite of a sharp fall. A spike means viewers rewound. Study the timestamp — you may want to replicate the technique in future videos.
Fixing the first 30 seconds
If you only optimize one part of your video, optimize the first 30 seconds. Every retention study we've done — across hundreds of channels ranging from 1K to 5M subscribers — shows the same distribution: roughly 40–55% of your total viewer loss happens in the opening window. That's the single highest-leverage editing surface on YouTube.
Here is the anatomy of an opening that holds:
- 0:00–0:03 — Confirmation. The first three seconds must confirm the viewer is in the right place. That means echoing the language, visual, or emotion of the thumbnail. No logo. No music sting. No "hey guys." Just a signal that says: yes, this is the video you clicked on.
- 0:03–0:10 — Promise. Restate the value of the video in a way that's more specific than the title. If the title is "How I edit faster," the promise might be "I'll show you the three keyboard shortcuts I use for 80% of my cuts and how I set them up in Premiere."
- 0:10–0:20 — Proof. Show, briefly, that you have the authority or receipts to deliver on the promise. A before/after, a stat, a screenshot, a result. Not credentials — evidence.
- 0:20–0:30 — Bridge. Introduce the first real section of the video with a sentence that connects it back to the promise. This is where you can finally say your name if you must.
❌ Weak opening
"Hey guys, welcome back to the channel, hope you're having a great week. Today we're going to talk about something I've been thinking about for a while now, which is…"
✅ Strong opening
"I edited this video in 40 minutes. Last year the same video took me four hours. Here are the three shortcuts that killed 90% of my mouse work — and how you set them up in Premiere in the next two minutes."
Notice what the strong version does. It confirms the topic in the first eight words. It uses a specific number (40 minutes vs. four hours) as proof. It promises three concrete deliverables and a time budget. A viewer who was on the fence about staying is now committed for at least the next 30 seconds — long enough to be pulled into the substance.
The hook-thumbnail-title triangle
Your first 30 seconds must land inside the triangle formed by your title, your thumbnail, and the viewer's expectation. If any corner of that triangle is misaligned, you get a cliff drop. This is why retention optimization sometimes has nothing to do with the video itself — it's a titling problem. Before you re-edit the opening, ask: does the first 10 seconds obviously deliver what the thumbnail promised? If not, the fastest fix is often to change the packaging, not the content.
Holding the middle
The middle of a video is where creators quietly bleed watch time. The intro either holds or fails within 30 seconds — the middle can lose viewers slowly for four minutes without you noticing. Below are the specific techniques that consistently flatten the middle-third slump.
The 30-second rule for pattern interrupts
Every 25–35 seconds, change something visible. It doesn't have to be big. A b-roll cut, an on-screen text overlay, a camera angle change, a zoom, a color grade shift, a location move, or a tonal pivot in delivery. The brain is a novelty detector; unchanging stimulus triggers a soft attention drop, and enough soft drops turn into hard drop-offs.
Sentence-level compression
The single most impactful edit you can make in a script is compressing sentences. Read your script aloud. Anywhere you use two clauses joined by "and" or "so" or "which is why," consider whether one clause carries the meaning. Anywhere you say "basically," "essentially," "kind of," or "you know" — cut it. Compression tightens pacing without losing content, and pacing is what the retention graph reads as energy.
Loops and open loops
An open loop is a promise you make and don't immediately deliver. "I'll show you the exact tool I used at the end of this video" is an open loop that pulls a viewer forward through slower material. Use them sparingly and always close them — an unresolved loop feels like a broken promise on rewatch and hurts session watch time.
Micro-stakes
Each section of the middle should have its own tiny question the viewer wants answered before they'd leave. "Will this actually work?" "What went wrong?" "How much did it cost?" If a section has no question attached, the viewer has no reason to keep watching that section. Add one — even a small one.
Where scripts usually break
If you upload a script to RetentionYT along with the video, it flags the sentences that historically correlate with drop-offs on your channel — long sentences, filler words, weak transitions, and pacing dead zones. It's the equivalent of a spellcheck for retention.
Retention-boosting techniques that actually work
Beyond diagnosing specific drops, there are structural techniques you can apply to every video going forward. These are the moves we see repeatedly on channels that consistently hold above 55% AVD on 10-minute-plus content.
1. Cold open with a scene, not a summary
Skip the setup. Open in the middle of the action, the demo, the result, or the tension. Then loop back to explain how you got there. This is the same technique that television uses for the first ninety seconds of a pilot episode. It works because it delivers curiosity before it demands attention.
2. The "what if" reframe
When you feel your script explaining rather than showing, rewrite that beat as a "what if" question. "What if I told you the reason your videos aren't ranking has nothing to do with the algorithm?" is a version of an idea. It's more magnetic than "the algorithm is often misunderstood, and here are some points about it."
3. Visual density
The number of distinct visual elements on screen per minute correlates strongly with retention on tutorial and essay content. This does not mean flashy — it means graphic overlays, illustrative b-roll, screen recordings, annotations, or physical props. If a viewer's eyes stay locked on the same static shot for 45 seconds, expect a dip. Break it up.
4. Contradiction as pacing
Every 90–120 seconds, contradict something you just said. "But here's the problem with that." "Except that doesn't actually work in practice." "You've probably heard the opposite advice — and it's not wrong, but…" Contradictions reset attention because the brain wants to hear how the tension resolves.
5. Numbered structure with visible progress
If your video has three points, tell the viewer up front there are three points. Then show the number on screen at each point. Progress bars — even implied ones — reduce the anxiety that produces drop-off, because the viewer feels oriented.
6. Cut ruthlessly on the second pass
The first edit of your video is for structure. The second edit is for pace. On the second edit, remove every sentence that doesn't advance the point. If you can cut 15% of your runtime without losing the argument, do it. Retention rewards density.
7. Anchor the ear as well as the eye
Audio has its own retention layer that most creators ignore. A subtle change in background bed, a room-tone shift, or a musical cue can act as a pattern interrupt without any visual change at all. This matters especially in talking-head content where the visual can only vary so much. Even a small volume dip beneath a key sentence signals emphasis and pulls attention back. If your video is 12 minutes of the same music bed at the same level, expect a soft slump around the 6-minute mark.
8. Deliver on your title in the middle, not the end
One counterintuitive move that consistently produces flatter curves: put the single most-promised element of your title around the 40–50% mark, not at the end. If your title is "I tried X for 30 days — here's what happened," the actual result should land near the middle, with the second half explaining, complicating, or extending the finding. Videos that hold the payoff for the outro usually leak viewers around 60–70% because the audience feels the payoff will arrive soon and stops watching the setup that would make it meaningful.
9. Use foreshadowing as an on-screen device
A small on-screen count ("3 things left") or a visual timeline in the corner reduces uncertainty about how much video is left. Uncertainty is a retention killer. Viewers are more likely to stay through a slow section if they can see it is bounded — the same reason a five-minute wait at a restaurant feels shorter with a visible timer than without one. This technique costs nothing to implement and shows up on almost every top-quartile channel.
10. End on an artifact
The final frame of your video should give the viewer something concrete — a checklist, a template, a URL, a book, a specific next action. "Thanks for watching" is not an artifact; it is closure. Closure is fine, but an artifact makes the video feel useful in retrospect, which improves the rewatch and session behavior downstream. It also gives you something specific to reference in your next thumbnail ("the template I gave you last time") that pulls returning viewers back with a warm start.
A test that costs nothing
Before you publish, watch your video at 1.5× speed. If any section still feels slow at 1.5×, it's slow at 1×. Cut it or restructure it.
Case example: before vs. after
Frameworks are easier to trust when you can see them applied end-to-end. The section below is an illustrative walkthrough built from a pattern we see constantly in audits — the figures model the mechanics rather than document a single real channel — and then briefly summarizes two additional patterns we see repeatedly on channels of different sizes. The point of a case study is not to copy the specifics — it's to internalize the diagnostic move.
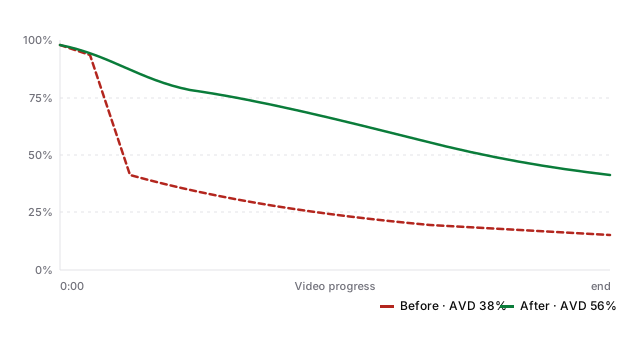
To make this concrete, picture a tutorial creator in the productivity niche with roughly 80,000 subscribers. Their videos consistently landed at 36–40% AVD across 12–15 minute uploads, well below their niche average of 48%. Below is the diagnostic and the rewrite.
The diagnosis
- Opening cliff at 0:12 — 22 percentage points lost. The intro used a 5-second animated logo followed by "hey friends, welcome back."
- Mid-video slump between 4:20 and 6:45 — a 6-point dip. This zone was a "context section" explaining the history of the tool being reviewed.
- Secondary cliff at 8:30 — sponsor read placed immediately after a low-energy paragraph. 4 points lost.
- Premature outro drop at 12:10 — creator said "so, that's about it" 40 seconds before the actual end.
The rewrite
- Removed the logo. New opening: creator on camera holding the product, saying "this replaced four apps I was paying for — here's what it does and where it fails."
- Cut the history section entirely. Replaced with a 20-second demo of the feature they were about to critique.
- Moved the sponsor read to immediately after the demo peak (viewers were emotionally satisfied), added a bridge sentence: "in a second I'll show you the one workflow it can't handle."
- Replaced "so that's about it" with a specific final tip that was strong enough to earn its own thumbnail moment.
The result
AVD moved from 38% to 56% across the next four uploads applying the same template. Absolute watch time — the metric YouTube actually ranks on — rose 47%. Impressions from the "suggested videos" surface roughly doubled over 60 days as the recommendation system responded to the improved retention signal.
"We didn't add anything. We removed the six sentences that were losing us half our audience."
Two shorter examples across niches
Gaming Let's Play, 210K subscribers. The creator was averaging 33% AVD on 25-minute uploads. The graph showed a healthy first act but a punishing slump between 8:00 and 14:00 as game exploration slowed. Fix: instead of adding commentary (the instinct most creators have), they cut the exploration entirely and replaced it with a 90-second timelapse edit. AVD moved to 44% on the next six uploads, and the channel's median view count doubled inside two months as the recommendation system reweighted them upward.
Video essay, 12K subscribers. The creator had a strong voice but was hitting only 41% AVD on 16-minute essays. The graph showed no single cliff — instead, a series of small slumps every 2–3 minutes. Diagnosis: chapter transitions that read on paper as thoughtful breaks were reading on video as energy drops. Fix: cold-open each chapter with a specific stat or image instead of a soft transition sentence. AVD moved to 53% within four uploads. This is a case where the fix wasn't cutting anything — it was reshaping how sections connected.
Notice the through-line across all three cases. None of them added more content. They all removed friction or rearranged existing material so the energy density stayed higher per minute of screen time. This is the single most reliable pattern in retention work: the fix is almost never "add value." It's "remove drag."
Retention benchmarks by niche and length
What counts as "good" retention depends heavily on niche and video length. The table below shows directional benchmark ranges — working reference points calibrated from the retention patterns we see in audits together with public creator reports. Use these as orientation, not absolutes — your channel's own historical median is the more important comparison.
| Niche | Under 5 min | 5–10 min | 10–20 min | 20+ min |
|---|---|---|---|---|
| Tutorials / how-to | 62–72% | 52–60% | 44–52% | 36–44% |
| Vlogs / lifestyle | 55–65% | 45–55% | 38–46% | 30–38% |
| Gaming (Let's Play) | 50–60% | 42–50% | 35–42% | 28–36% |
| Video essays | 68–78% | 58–68% | 48–58% | 40–50% |
| Product reviews | 60–70% | 50–58% | 42–50% | 34–42% |
| Finance / business | 58–68% | 48–56% | 40–48% | 32–40% |
| News / commentary | 52–62% | 44–52% | 36–44% | 28–36% |
| Educational (deep dive) | 65–75% | 55–65% | 46–56% | 38–48% |
Two observations that apply across every niche. First, retention percentage declines predictably with length — because a longer video has more surface area to lose viewers, not because it's worse. A 20-minute video at 40% AVD is watched 8 minutes on average; a 6-minute video at 60% AVD is watched 3.6 minutes. YouTube ranks the longer one higher, all else equal.
Second, the top 10% of channels in any niche consistently sit 8–15 percentage points above these medians. That gap is almost never a talent difference — it's a scripting and editing discipline difference. Every technique in this article is applied ruthlessly on those channels, video after video.
Two benchmarks that matter more than niche averages. The first is your own historical median — the middle value across your last 20 uploads. If a new video sits above the median, you're learning; if it sits below, you have a diagnostic assignment. The second is the gap between your best and worst videos of similar length. Channels with a narrow gap (10 percentage points or less) tend to be more predictable in growth because the recommendation system can trust them. Channels with a wide gap swing between viral hits and quiet dips because the platform can't infer a stable signal. Narrowing that gap by lifting the floor — not chasing the ceiling — is usually the fastest path to steady growth.
Finally, a note about Shorts benchmarks. Because Shorts are almost always watched to completion or swiped in the first few seconds, retention there is bimodal. A healthy Short shows either 80%+ or under 30%, with very little in between. The intervention is entirely front-loaded: the first frame, the first spoken word, and the first cut do 90% of the work. If a Short is holding 45%, it is not a mediocre Short — it is two problems stacked on top of each other, usually a weak first frame plus a delayed payoff.
An actionable framework for weekly retention review
Consistency beats intensity. Here is the review cadence we recommend to creators publishing at least once a week. It takes 20–30 minutes per video and compounds fast.
Step 1 — Screenshot the graph 48 hours after upload
Retention data stabilizes after roughly 48 hours (most videos have received the majority of their initial impressions by then). Screenshot the graph or export the CSV. This is your baseline.
Step 2 — Mark the four zones
On the screenshot, draw a box around: (a) the first 30 seconds, (b) any cliff drops of 5+ percentage points, (c) any slump zones lasting 30+ seconds, (d) any rewatch spikes. This is your working set.
Step 3 — Match each zone to a sentence
Open your script or transcript. For each marked zone, identify the sentence(s) that correspond to that timestamp. Write them down. This is the raw material for your next rewrite.
Step 4 — Categorize each drop
Assign each cliff or slump to a pattern (A–F from the diagnosis section). Group similar patterns across videos. If you notice you keep having Pattern C (mid-video slump) every third video, that's your top priority to fix systemically.
Step 5 — Choose one experiment per upload
Don't rewrite everything at once. Pick one hypothesis — "I'll cut my logo intro" or "I'll add pattern interrupts every 25 seconds in the middle" — and test it on the next video, previewing the revised script's simulated drop-off curve in the retention prediction tool first. Measure the delta. Keep what works.
Step 6 — Study your spikes
Once a month, look at every rewatch spike from that month and ask what they have in common. This is your positive template. The best channels don't just remove what fails — they codify what works and replicate it.
Retention checklist for creators
Print this. Tape it above your editing station. Run through it before every publish.
- The first 3 seconds visually and verbally confirm the thumbnail promise
- There is no logo, no music sting, and no "hey guys" before 0:15
- The video's specific promise is restated within the first 10 seconds
- Evidence or proof of the promise appears before 0:20
- Every 25–35 seconds contains a pattern interrupt (b-roll, cut, overlay, tone shift)
- No sentence uses more than one filler word (basically, essentially, kind of, you know)
- Sponsor reads are placed after an emotional peak, not before
- Sponsor reads include a bridge sentence promising what comes next
- Mid-video has at least one open loop that gets closed before the outro
- The final 15 seconds contain a specific line, tip, or visual — not "that's about it"
- You watched the video at 1.5× and nothing felt slow
- The title, thumbnail, and first 10 seconds are inside the same triangle of expectation
- You know which pattern (A–F) you're actively trying to improve on this upload
Stop guessing. See which sentences lost your viewers.
RetentionYT aligns your transcript to your retention graph, flags every drop-off zone, and gives you script-level rewrites you can apply before your next upload.
Try RetentionYT free →
Frequently asked questions
What is a good YouTube retention percentage?
For most niches, an average view duration (AVD) of 50–60% of the video length is considered strong, and 40–50% is average. Shorter videos (under 5 minutes) can hit 65–75%, while longer videos (20+ minutes) often perform well at 35–45% because absolute watch time still favors ranking.
Where do I find the retention graph in YouTube Studio?
Open YouTube Studio, click Content, choose the video, then click Analytics and the Engagement tab. Scroll to "Key moments for audience retention" — that graph is your retention curve. Hover any point to see the exact moment and percentage.
What causes viewers to drop off in the first 30 seconds?
The three most common causes are a slow hook, a mismatch between the title/thumbnail and the actual opening, and generic intros with logos, music, or unrelated small talk. Viewers arrive with a promise in mind — the first 15 seconds must confirm they are in the right place.
What is a mid-video slump on the retention graph?
A mid-video slump is a pronounced dip in retention between roughly 40% and 65% of video progress. It typically signals a pacing collapse — over-explaining, a tangent, or missing pattern interrupts. Tightening this section usually recovers the largest share of lost watch time.
Do retention spikes actually mean people are rewatching?
Yes. When the curve rises above the baseline, it means more viewers watched that moment than the moment before it — usually because people rewound to see something again. Spikes are a signal of high value and are worth studying and replicating.
How does YouTube use retention to rank my video?
YouTube's recommendation system optimizes for viewer satisfaction, which correlates strongly with watch time and average view duration. Videos with better retention earn more impressions, higher click-throughs on suggested feeds, and stronger session watch time — the compounding effect that drives channel growth.
How long should my video be for the best retention?
There is no single ideal length. The right length is whatever your idea justifies — no shorter, no longer. YouTube rewards absolute watch time, so a 12-minute video at 55% AVD outperforms a 6-minute video at 65% AVD in ranking signals, provided both are genuinely engaging.
Should I re-upload a video with bad retention?
Rarely. Re-uploading resets your data but does not fix the underlying script. It is almost always better to apply retention lessons to your next video. Only re-upload if the original had a critical error (wrong file, broken audio) that fundamentally misrepresents the content.
Conclusion
The retention graph is the closest thing YouTube gives you to a director's cut of your own video — annotated by the audience, second by second, with the honesty only anonymity produces. Every creator who plateaus and every creator who breaks through has access to the same instrument. The difference is whether they read it, or whether they close the tab.
Two ideas are worth carrying with you as you leave this article. The first is that retention is not a talent — it is a habit. The creators who consistently hold 55%+ AVD are not more charismatic than the ones who hold 35%; they simply run the review loop we described above every single week, and they let each upload teach them one lesson about their own audience. Over a year of publishing, that is fifty lessons stacked. There is no shortcut that beats that stack.
The second idea is that improvement is almost never about doing more. It is about doing less, more precisely. Nearly every rewrite we've walked through in this guide was a subtraction — a removed logo, a cut history section, a deleted filler word, a compressed sentence. If you take one editing habit from this piece, let it be the habit of looking at your worst 30 seconds and asking "what would happen if I just deleted this?" The answer, more often than you'd expect, is: the video gets better.
You now know how to read it. You know the four movements (gradual, cliff, slump, spike), the six diagnostic patterns (A through F), the anatomy of the first 30 seconds, and the six structural techniques that keep the middle from collapsing. You have benchmarks, a checklist, and a weekly review framework. What remains is the discipline of applying one lesson per upload — and letting the compounding do the rest.
If you want the diagnostic step done for you, RetentionYT pairs your graph with your transcript and gives you the sentence-level rewrites automatically. If you want to go further into the ideas in this article, the related reading below is where creators usually go next.
Continue reading
- RetentionThe First 15 Seconds: Anatomy of a YouTube Hook That Works
- RetentionHow to Fix a Mid-Video Slump (with 7 Pacing Techniques)
- AnalyticsAverage View Duration Explained: The Metric YouTube Really Ranks On
- ScriptingWriting Hooks That Hold: A Line-by-Line Framework
- RetentionThe Optimal YouTube Video Length (It's Not What You Think)
- EditingPattern Interrupts: The 25-Second Rule for Holding Attention
RetentionYT Editorial
The RetentionYT research team analyzes retention data across thousands of creator channels to identify the script, hook, and editing patterns that most reliably improve average view duration. Our writing is reviewed by working YouTube creators before publication.
External references: YouTube Help — audience retention, YouTube Creator Academy, Official YouTube blog on the recommendation system.
Frequently asked questions
- Where do I find the retention graph in YouTube Studio?
- Open YouTube Studio, click Content, choose the video, then click Analytics and the Engagement tab. Scroll to "Key moments for audience retention" — that graph is your retention curve. Hover any point to see the exact moment and percentage.
- Do retention spikes actually mean people are rewatching?
- Yes. When the curve rises above the baseline, it means more viewers watched that moment than the moment before it — usually because people rewound to see something again. Spikes are a signal of high value and are worth studying and replicating.
- Should I re-upload a video with bad retention?
- Rarely. Re-uploading resets your data but does not fix the underlying script. It is almost always better to apply retention lessons to your next video. Only re-upload if the original had a critical error (wrong file, broken audio) that fundamentally misrepresents the content.
Find your video’s drop-off points before you publish
RetentionYT audits your script for the moments viewers leave — so you can fix them before recording.
Get retention tips in your inbox
Occasional, practical emails on hooks, pacing, and retention. No spam.
Related posts
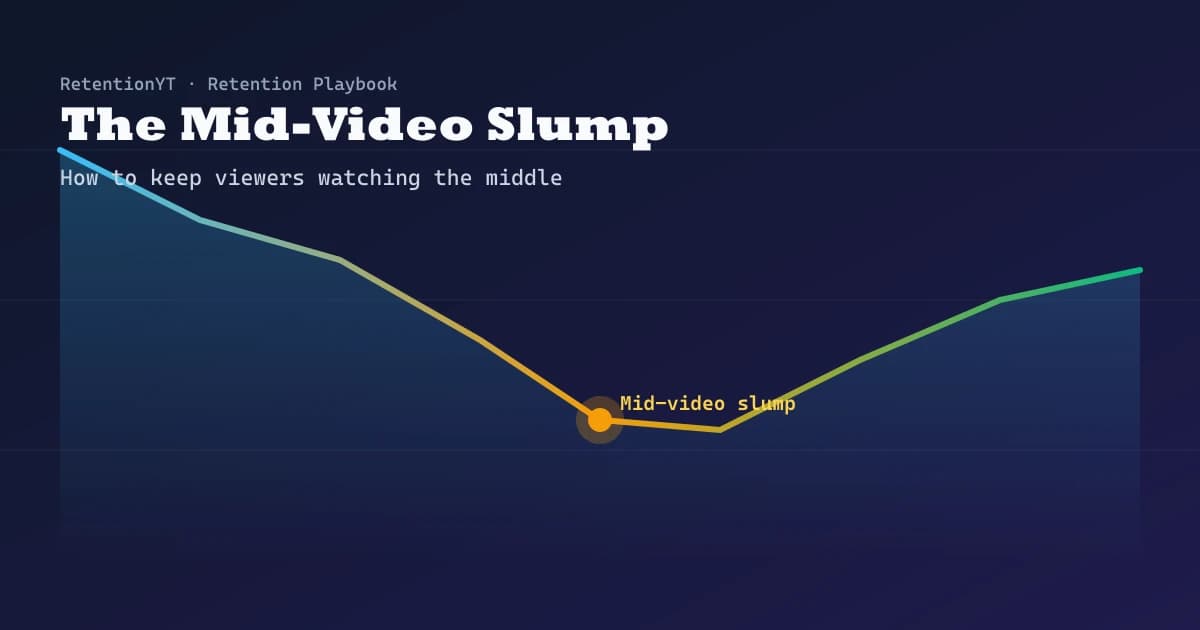
The Mid-Video Slump: How to Keep Viewers Watching the Middle
The hook gets the attention — the middle is where you lose it. Learn how to diagnose the mid-video slump, hold the sagging middle of your YouTube video, and lift average view duration with proven retention techniques.
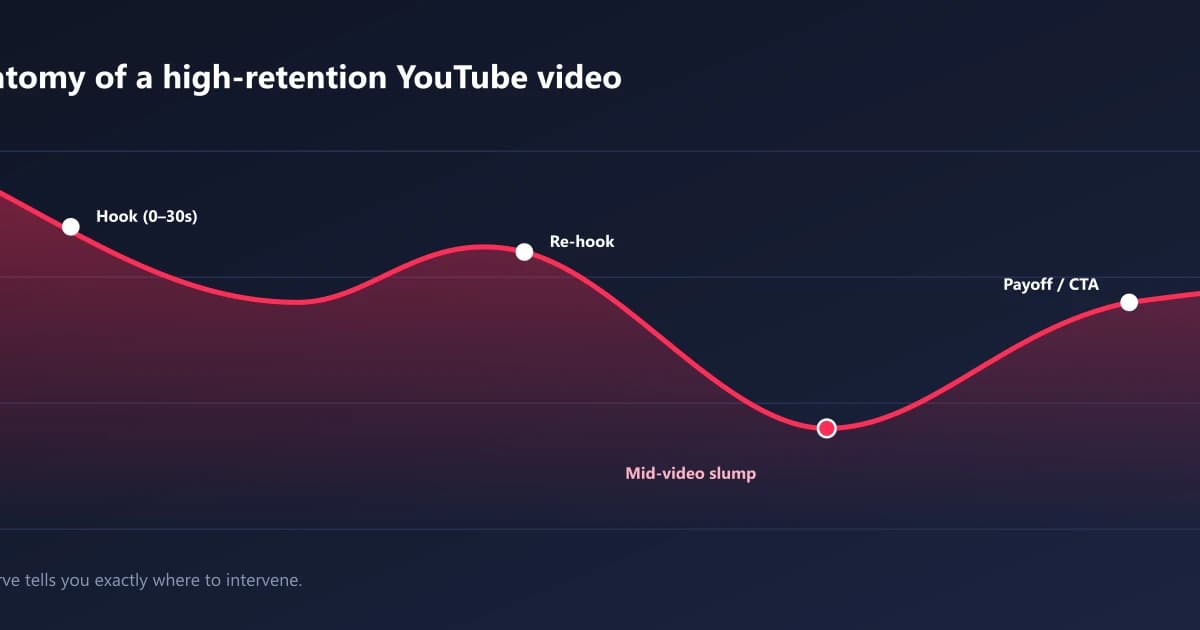
5 Ways to Improve Your YouTube Audience Retention
Audience retention is the #1 signal YouTube uses to promote videos. Learn 5 proven, data-backed ways to improve YouTube audience retention — hooks, pacing, re-hooks, structure and analytics tactics.
Pattern Interrupts: How to Reset Viewer Attention Every 45 Seconds
Pattern interrupts reset viewer attention before habituation sets in. Learn the neuroscience, the timing cadence, 14 concrete techniques, and a diagnostic workflow for holding attention.