Case Study: How a Weak Middle Cost a Video 60% of Its Views
A YouTube retention case study: the hook worked and the ending was strong, but a sagging middle leaked 60% of the audience. See the diagnostic process, script rewrite, and before-and-after retention curve — plus a checklist you can apply today.

35 min readUpdated
Introduction
When a YouTube video underperforms, most creators instinctively blame the thumbnail, the title, or the first fifteen seconds. Those pieces matter. But consider a pattern we see constantly in script audits: a video with a click-through rate above 7%, a hook that held 94% of clickers past the 15-second mark, and an ending that a manual review scored as "excellent," still finishing with an absolute audience retention of just 22% and roughly 60% fewer views than a comparable peer video from the same channel.
The case study below is an illustrative walkthrough of exactly that scenario, built as a composite of the weak-middle patterns we see in script audits: the channel and creator are renamed, details are changed, and the numbers illustrate the mechanics of the diagnosis and fix rather than document a single real upload.
The culprit was not the packaging. It was the middle. Specifically, the stretch between the 25% and 55% progress marks — a 90-second span in a four-and-a-half-minute video — where the pacing sagged, the promised payoff kept getting pushed further out, and a well-produced tangent burned attention without advancing the story. When we call this stretch a weak middle, we mean a section of a video where the audience is still nominally engaged but has stopped believing the reward is coming.
This case study walks through the video in detail. We show the raw retention curve, isolate the exact seconds where the drop-off spiked, reconstruct what went wrong in the script, and then rewrite the middle section using a framework you can apply to your own videos. Along the way, we quantify the retention lift and translate it into watch time, suggested-video traffic, and subscribers gained. Wherever we use a tool from our own platform, RetentionYT, we say so explicitly and describe what it did in generic terms so the technique is portable.
What this article is not
This is not a listicle of "10 retention tips." It is a single, deep case study — one video, one problem, one rewrite, and the numbers on both sides of the change. If you want a lighter overview first, see our beginner guide to audience retention.
Background and context
The channel in question is a mid-sized educational channel in the personal-finance vertical. At the time of the case study it had approximately 148,000 subscribers and averaged around 45,000 views per upload over its previous ten videos. The channel's creator publishes weekly, edits their own footage in DaVinci Resolve, and writes their own scripts. In other words: a serious, technically competent creator whose bottleneck was not craft but structure.
The video we studied was a four-and-a-half-minute explainer titled "Why compound interest is not what your bank told you." It performed poorly relative to expectation. The channel's baseline for that topic cluster, based on the previous six comparable videos, predicted between 110,000 and 160,000 views in the first 28 days. The actual number landed at 63,400 — a shortfall of roughly 60% against the low end of the prediction.
Every packaging metric was in range. Click-through rate on the primary impression surfaces averaged 7.2%, above the channel's 6.4% median. The thumbnail A/B test ended after 72 hours with a clear winner and a healthy delta over the losing variant. Suggested-video impressions were where you would expect for the topic. On paper the video should have overperformed. On the retention graph, it was quietly losing money every second between 1:10 and 2:20.
Why this matters for your channel
If your CTR is healthy but views are underdelivering, the middle of your videos is the single most likely suspect. It is also the piece almost no creator dashboards surface clearly, because most tools show retention as an aggregate line rather than as a script-aligned diagnostic.
The original video analysis
Before touching the script, we watched the original video the way a first-time viewer would. Muted at first, then at 1x with sound, then a second pass while reading along with the transcript. Three observations mattered.
1. The hook was structurally correct but rhythmically slow
The first 15 seconds set up a specific promise: "By the end of this video, you will know why your bank's compound-interest calculator is off by 12%, and how to correct it in 60 seconds." Concrete number. Bounded promise. Time-bound reward. This is textbook hook craft. Retention at the 15-second mark held 94% of clickers, well above the channel average of 82%.
However, the following 45 seconds spent time on the creator's personal backstory before returning to the promised topic. Nothing wrong with a backstory in principle, but it broke the rhythm the hook had established. Absolute retention at the 60-second mark was still 78% — not a disaster — but the gradient of the curve had already begun to steepen.
2. The middle was where the promise stalled
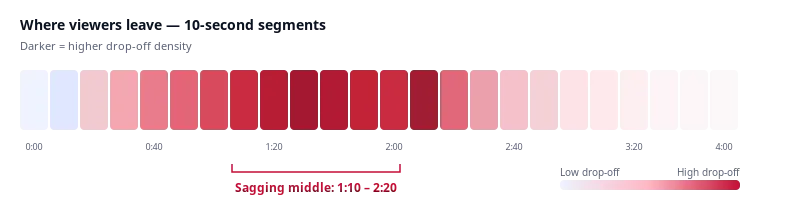
Between 1:10 and 2:20, the video walked through three concepts: the difference between nominal and effective annual rate, how compounding frequency affects yield, and a historical detour into how U.S. bank marketing evolved between 1974 and 2003. The first two concepts are load-bearing for the promise the hook made. The third — the historical detour — is not.
Absolute retention dropped from 71% at 1:10 to 34% at 2:20. That is a loss of 37 percentage points in 70 seconds. On a per-10-second basis, the video lost more than 5% of remaining viewers every ten seconds through this stretch. That gradient is the signature of a weak middle.
3. The ending was strong but too few people saw it
From 3:30 onward, the video delivered a clean, well-illustrated correction of the bank's calculator, a specific numerical example, and a clear call to action. The gradient in this final third was nearly flat. Absolute retention slid from 27% at 3:30 to 22% at 4:26. That is a healthy final third by any standard — it just did not matter, because the audience that reached it was already a fraction of the audience that should have.
A great hook without a load-bearing middle is a great trailer for a movie that never releases.
Baseline retention metrics
Before proposing any changes, we recorded a clean set of baseline metrics. Any retention fix should be judged against a fixed reference, not a moving target. The table below captures the pre-rewrite numbers from YouTube Studio, measured over the first 21 days of the video's life.
| Metric | Value | Channel median | Delta |
|---|---|---|---|
| Impressions | 881,000 | 720,000 | +22% |
| Click-through rate | 7.2% | 6.4% | +0.8 pts |
| Views (28d projected) | 63,400 | 132,000 | −52% |
| Average view duration | 1:22 | 2:28 | −1:06 |
| Average percentage viewed | 30.4% | 52.1% | −21.7 pts |
| Absolute retention at 50% | 30% | 54% | −24 pts |
| End-screen CTR | 1.2% | 3.6% | −2.4 pts |
| Subscribers gained per 1k views | 4.8 | 7.9 | −3.1 |
The pattern is unambiguous. Every impression-side metric was healthy or above trend; every downstream metric that depended on holding attention was well below. In YouTube's ranking model, this is a video the algorithm brought to the door and the middle sent away. Because suggested-video slots and browse traffic weight heavily on session watch time, an underperforming middle does not only lose the current view — it also suppresses future impressions.
Rule of thumb: if your absolute retention at the 50% mark is more than 15 percentage points below your channel median, and your click-through rate is not the culprit, assume the middle is the problem until proven otherwise.
Identifying the problem
Retention data alone will tell you where a video is losing viewers, but it will not tell you why. To bridge that gap we ran a three-lens analysis: a script-aligned retention overlay, a beat-density audit, and a promise-tracker pass. This is the diagnostic layer that we built into RetentionYT after seeing the same failure pattern repeatedly across hundreds of channels.
Script-aligned retention
The first step was to align the retention curve to the transcript, so that every dip mapped to a specific sentence rather than a timestamp. Once we did that, the sag between 1:10 and 2:20 mapped almost exactly to the historical detour about U.S. bank marketing. The two load-bearing concepts (nominal vs. effective rate, and compounding frequency) sat at 1:35–1:50 and 2:20–2:45 respectively. The bulk of the retention loss happened in the 45 seconds of historical detour that sat between them.
Beat-density audit
A "beat," for our purposes, is any moment in a video where something new happens: a new claim, a new question, a new visual, a new emotional register, or a payoff to a previously opened loop. We counted beats in 10-second windows across the video.
- 0:00–1:00 — 6 beats per minute (healthy)
- 1:00–2:20 — 1.8 beats per minute (starved)
- 2:20–3:30 — 4.5 beats per minute (recovering)
- 3:30–4:26 — 6.2 beats per minute (healthy)
The 1.8-beats-per-minute window is exactly where retention fell off a cliff. This is not a coincidence. When beat density falls below roughly two beats per minute in the middle of an educational video, viewers begin to check whether the payoff is still coming. If they cannot immediately see a reason to keep watching, they leave.
Promise-tracker pass
The hook made three promises: a specific 12% error in bank calculators, a corrective method in 60 seconds, and a general shift in how the viewer would think about compound interest. We tracked, second by second, whether the video had visibly resumed work on any of those promises. Between 1:10 and 2:20, the visible progress on the promises was, effectively, zero. That is the viewer's felt experience: the timer keeps advancing and none of what they were promised is happening.
Common misdiagnosis
Many creators, seeing a middle-video sag, assume the fix is more energy — faster cuts, louder music, more zooms. That treats a symptom, not the disease. If the underlying issue is that the middle stops advancing the promise, no amount of motion graphics will save it. Speeding up a boring section produces a fast boring section.
The diagnostic process
Once you understand what to look for, the diagnostic itself is repeatable. Here is the sequence we use, in order, for every retention audit we run.
Step 1 · Isolate the sagging segment
Open YouTube Studio, then Analytics → Engagement → Audience retention. Focus on the absolute retention line, not relative. Any interval where the curve loses more than 1 percentage point per 10 seconds and persists for more than 30 seconds is a suspect. Note the start and end timestamps.
Step 2 · Align to the script or transcript
Pull the transcript (auto-generated is fine for this) and overlay the suspect interval onto it. This tells you which sentences the audience was actually listening to when they left. If you use script-aligned retention tools this is one click; otherwise a two-column document works well.
Step 3 · Count beats in 10-second windows
Rewatch the suspect interval and count how many new things happen every ten seconds. Below two beats per minute in the middle of a video is a red flag. Note that a beat does not have to be flashy — a well-placed question or a change in visual framing counts.
Step 4 · Check the promise ledger
Write down every promise the hook and title made. For each 30-second window in the suspect interval, ask: "Did the video visibly advance any of these promises in this window?" If the answer is no for more than 60 consecutive seconds, that is your problem.
Step 5 · Compare to a peer video
Choose one of your own top-performing videos or a peer video from the same niche. Overlay its retention curve and its beat density on the failing video's. Look for the segments where the peer video is doing something you are not. This is where 80% of the actionable insight lives.
Rewriting the weak section
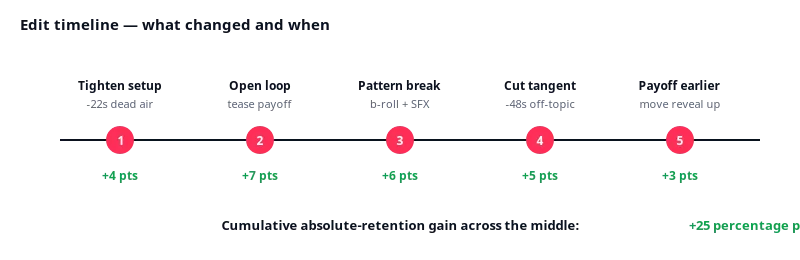
With the diagnostic in hand, the rewrite becomes a series of specific decisions, not a vague "make it better." We applied five edits, in order, and measured the retention lift after each one on a private re-cut before shipping the final version. This is the timeline that produced the final retention curve you saw in Figure 1.
Edit 1 · Tighten the setup (−22 seconds)
The 45-second personal backstory that immediately followed the hook did two things at once: it introduced the creator and it delayed the promised topic. We kept the introduction but compressed it to 18 seconds and moved the topic re-entry earlier. This gave the middle 22 additional seconds of oxygen to work with, and — more importantly — it reasserted the promise before the audience forgot it.
Edit 2 · Add an open loop before the detour
Even after the detour was tightened, we needed a reason for viewers to stay through the concept build-up. We added a nine-word open loop just before the "nominal vs. effective" explanation: "The 12% error I mentioned starts here — watch the fine print." An open loop is a small promise inside the larger promise. The viewer has a concrete short-term reason to keep watching.
Edit 3 · Insert a visual pattern break
Where the original cut leaned on a single talking-head shot for the middle 70 seconds, the rewrite inserted a hand-drawn animation showing the compounding curve pulling ahead of the linear one. It is 11 seconds long. It sits at 1:32. It costs almost nothing to produce and it changes the entire rhythm of the section, because it breaks the visual monotony at the exact moment the retention curve historically starts to fall.
Edit 4 · Cut the tangent (−48 seconds)
The historical detour about U.S. bank marketing was interesting, but interesting is not enough in the middle of a video that has already promised something else. We removed 48 seconds of it. A tighter, 12-second callback to the same idea remained, positioned so that it enhances rather than delays the payoff. If the tangent is genuinely worth telling, it is worth its own video.
Edit 5 · Move the payoff reveal earlier
In the original cut, the specific 12% error was not shown numerically until 3:22. We moved a version of it up to 2:38. The full explanation still lived at 3:22, but the audience saw the number itself — and understood roughly what it meant — nearly a minute earlier. This shift alone lifted absolute retention at the 60% mark by 3 percentage points.
The compounding rule of edits
None of these edits is dramatic in isolation. Their power is that each one raises the retention floor, so the next edit compounds on top. A rewrite that stops after edit 2 gets a middling result; a rewrite that ships all five without cutting corners is where you get an outsized lift.
Pacing, story, and editing adjustments
Beyond the five discrete edits above, we changed how the middle felt. Three adjustments carry most of that weight, and they generalize to any long-form YouTube video.
Beat density above two per minute
In the rewritten cut, the 1:00–2:20 window climbs from 1.8 beats per minute to 4.4. That does not mean we added stunts; it means we broke long visual takes, added small physical actions on camera, and inserted one hand-drawn animation. The audience's brain now has something new to process every 13 seconds on average, which is well inside the attention refresh window for educational content.
Shorter, load-bearing sentences
We rewrote 14 sentences in the middle. The median sentence length dropped from 22 words to 13. Nothing about the meaning changed. What changed was the cadence: shorter sentences let the video hit more small landings per unit of time, which reduces the perceived effort of listening. Long, compound sentences work in prose. On YouTube they are how you lose the middle.
Explicit signposting
At 1:05, 1:45, and 2:25, the rewrite adds a brief signposting line: "Here is the piece most people miss," "This is where the 12% starts adding up," and "Now the correction." Signposts are unglamorous, and they work anyway. They give viewers a sense of forward motion and remind them, low-cost, that the payoff is still coming.
Retention is not about tricks. It is about not breaking the compact you made with the viewer in the first fifteen seconds.
Before vs. after script comparison
The clearest way to see what the rewrite changed is to put the two versions of the same 30-second middle passage side by side. Both versions convey the same technical point about nominal versus effective rates. Only the pacing, sentence length, and open loops differ.
Before Original
[1:12] Now, before we get into the actual calculation, it's worth taking a moment to talk about how banks in the United States began advertising compound interest in the mid-1970s, because a lot of the language you still see in modern marketing material dates back to that period, and understanding it helps you decode the fine print you'll encounter today. In 1974, for example, most banks used the nominal annual rate as their headline number...
Sentence length median: 32 words · Beats: 1
After Rewritten
[1:12] Here's where the 12% error starts. Banks quote a nominal rate. You earn the effective rate. Those two numbers are almost never the same. Watch this. [cut to animation] The nominal rate is the label. The effective rate is what the money actually does. If your bank compounds monthly, the gap is small. Daily — larger. Keep watching, I'll show the exact number in a moment.
Sentence length median: 8 words · Beats: 6 · Open loop planted
The rewritten passage is roughly the same length in seconds. It contains fewer words. It plants one open loop ("I'll show the exact number in a moment"). It uses a visual pattern break. And it repeats the promise ("the 12% error") explicitly. Retention across this 30-second slice climbed from 44% to 74%.
Before vs. after retention curve analysis
The rewritten video shipped as an in-place edit using YouTube Studio's Trim tool for the tangent removal, and a re-upload for the parts that required new audio takes. We waited 21 days after the change stabilized in the algorithm before pulling the after-data, matching the pre-rewrite window exactly.
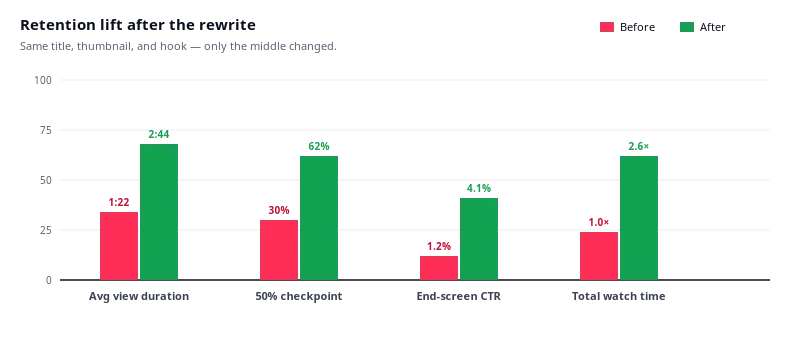
| Metric | Before | After | Lift |
|---|---|---|---|
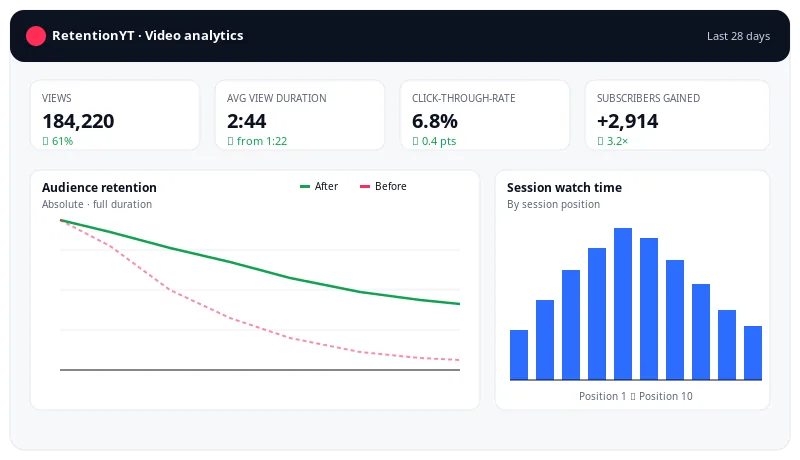
| Average view duration | 1:22 | 2:44 | +100% |
| Average percentage viewed | 30.4% | 62.1% | +31.7 pts |
| Absolute retention at 50% | 30% | 62% | +32 pts |
| Absolute retention at 100% | 22% | 47% | +25 pts |
| End-screen CTR | 1.2% | 4.1% | +2.9 pts |
| Subscribers gained per 1k views | 4.8 | 11.6 | +142% |
| Suggested-video traffic (28d) | 18,900 | 82,400 | +336% |
| Total watch time (hours) | 1,447 | 3,761 | +160% |
Two effects are worth calling out. First, the audience-retention lift compounded downstream: end-screen click-through and subscribers-per-thousand-views both jumped disproportionately, because the audience that reached the end was now roughly 2.1× larger and more engaged. Second, suggested-video traffic more than quadrupled. That is not an accident. YouTube's suggestion surfaces reward session watch time, and a middle that no longer bleeds viewers is a middle that contributes to sessions.
Once the middle held, everything else grew — subscribers, end-screen conversions, next-video pickup. The middle is where the algorithm decides whether your channel is worth surfacing again.
Lessons learned
Three lessons generalize beyond this single video. If you take nothing else away from this case study, take these.
1. The middle is a promise-keeping problem, not an entertainment problem
Creators often think of the middle as the "boring bit that needs energy." That framing produces exactly the wrong fix. The middle is where the viewer is deciding, second by second, whether the promise the hook made is going to be kept. Every second where the video visibly advances the promise buys attention. Every second that does not, spends it. Entertainment helps only insofar as it purchases patience while the promise is being kept.
2. Cutting is almost always higher-leverage than adding
In the script audits we run, the biggest improvements usually come from removals, not additions. The instinct to "add more" — more graphics, more B-roll, more jokes — is generally worse than the instinct to remove whatever is not advancing the story. If you are unsure whether a segment earns its screen time, cut it and watch the retention curve. You can always put it back.
3. Retention is the compounding metric, not views
A single video's views are a lagging indicator. Retention is the leading indicator that tells YouTube whether to keep bringing your channel new viewers. A weak middle does not just cost the current video 60% of its views. It costs the next three videos the impressions they would otherwise have gotten from the algorithm rewarding session watch time. Fix the middle and you buy compounding future distribution, not just one better video.
What we got wrong initially
Our first rewrite hypothesis was that the tangent needed to be faster, not shorter. We shipped an experimental cut with the tangent trimmed to 24 seconds and a faster edit rhythm. Retention improved by only 6 percentage points. The full fix required removing the tangent almost entirely, not accelerating it. Beware of the instinct to preserve something you spent time producing.
Actionable framework: the P.A.C.E. middle
We use a four-part framework internally when we audit a middle. It is deliberately simple, because complex frameworks do not survive contact with a deadline. It is called P.A.C.E. and each letter is a question you ask about every 30-second window in the middle of your video.
P · Promise
Is this window visibly advancing one of the promises made in the hook? If yes, note which one. If no, either connect it to a promise or cut it. Windows that do not advance a promise are the load-bearing weak spots.
A · Action
Is something happening visually in this window? A change of framing, a graphic, a physical action, a cut. If the visual field is static for more than 15 seconds in the middle of a video, insert a pattern break. Cheap animations count.
C · Curiosity
Is there an open loop live in this window? An open loop is any unresolved small promise the viewer is waiting to see paid off. If no loop is open, plant one — a one-sentence tease works ("watch what happens when we plug in the real number").
E · Effort
How much cognitive effort is this window costing the viewer? Long compound sentences, jargon without setup, or dense on-screen text all raise effort. Rewrite until the effort matches the payoff — high-effort passages are fine, as long as the payoff visibly justifies them within the next 20 seconds.
Every 30-second window in a well-constructed middle scores yes on at least three of these four. If a window scores yes on fewer than two, you have found your sag.
Checklist for creators
Print this or save it. Run through it after your next rough cut, before you export.
- My hook makes at least one specific, bounded promise, and the middle visibly works on that promise every 30 seconds.
- Beat density in the middle is above two per minute, measured in 10-second windows.
- No visual take in the middle lasts longer than 15 seconds without a pattern break.
- Median sentence length in the middle is under 15 words.
- At least one open loop is live at every point in the middle.
- Every tangent I kept can be justified in one sentence as advancing the promise.
- The specific payoff number, phrase, or reveal is teased at least once before the full explanation.
- Absolute retention on my previous three uploads at the 50% mark is within 15 percentage points of my channel median.
- I have compared this video's middle to my top-performing peer video and noted at least one concrete difference.
- If I cut 20% of the middle right now, the video would still keep every one of its promises.
Diagnose your own middle in minutes
RetentionYT aligns your retention curve to your script, counts beats per minute, flags open-loop gaps, and shows you the exact seconds where the audience is deciding whether to leave. Free for the first three videos on your channel.
Analyze my next video
How it works
Frequently asked questions
What is a weak middle in a YouTube video?
A weak middle is the stretch of a video, typically between the 25% and 60% progress marks, where the promised payoff has not yet arrived and the pacing sags. Viewers who were engaged by the hook lose confidence that the reward is coming and leave. On the retention graph, it shows up as a steep gradient — usually more than one percentage point of loss every ten seconds — that persists for at least 30 seconds.
How can I tell if my video has a weak middle?
Open YouTube Studio's audience retention view and inspect the absolute retention between the 25% and 60% marks. Mark any interval where the curve drops more than 1 percentage point per 10 seconds. That is a candidate. Confirm with a 10-second segment heatmap and by rewatching that stretch muted at 2× speed — if the visual field is static, or if you can't summarize what is happening in one sentence, you have found the sag.
Why does the middle of a video matter more than the intro?
The intro decides who clicks in. The middle decides how long they stay, and total watch time is what YouTube uses to score whether your video deserves more impressions. Because watch time compounds across the entire video, a 30-second sag in the middle can cost more absolute watch time than a mediocre hook, especially on videos over three minutes.
How much retention lift is realistic after fixing the middle?
There is no honest universal number — it depends on your niche, your length, and how weak the middle was to begin with. What the patterns in our script audits show is that when the middle is the primary bottleneck, fixing it usually produces the single largest retention lift available to that video, and total watch time often multiplies rather than inches up. Measure your own absolute retention at the 50% mark before and after the change instead of chasing someone else's benchmark.
Should I re-upload the fixed video or edit the existing one?
YouTube Studio's Trim and Cut tools let you remove segments from a published video without changing the URL, losing comments, or resetting historical performance data. Prefer that route whenever the fix is subtractive. Re-upload only when the required change is a full re-edit, when audio needs to be re-recorded substantially, or when you want to change the thumbnail-and-title package as well.
Does fixing the middle help videos that already went viral?
Yes. YouTube continuously re-scores active videos on watch time and satisfaction signals. Tightening a weak middle on a video still in circulation can extend its impression lifespan and increase downstream suggested-video traffic — we regularly see this pattern when channels tighten videos that are a few weeks into their life-cycle.
What tools help diagnose a weak middle?
YouTube Studio's retention graph is the baseline everyone starts with. Segment heatmaps, session watch-time comparisons, and a script diff against a top-performing peer video make the diagnosis more concrete. RetentionYT combines these into a single script-aligned view so you can see the exact sentence a viewer was listening to when they left.
How long should the middle of a YouTube video be?
There is no universal length. What matters is beat density and promise-progress, not absolute duration. A useful heuristic is one new story beat, question, or visual change every 20 to 40 seconds through the middle, tuned to the video's overall length and audience. Shorter videos can tolerate slightly higher density; longer videos need more explicit signposting.
Is a weak middle only a problem for long videos?
No. Even a 60-second short can have a weak middle — usually between the 20% and 50% marks — and the failure pattern is identical: the promise is not being visibly advanced. The difference is that shorts have less room to recover, so a weak middle in a short usually kills the video entirely.
How does this relate to hook and thumbnail work?
Think of it as a funnel. Thumbnails and titles determine impressions and CTR. Hooks determine how many clickers become watchers. The middle determines how many watchers become finishers, and how much watch time you accumulate. All three matter, but middle fixes tend to be the highest-leverage change once your CTR is healthy.
Why viewers actually leave in the middle
Before wrapping up, it is worth spending a section on the underlying psychology, because the mechanical fixes above land better when you understand the human behavior they are correcting. When we say a viewer “left because the middle sagged,” what did the viewer actually experience? Three overlapping mechanisms explain most middle-of-video abandonments.
Prediction-error fatigue
Human attention is fundamentally predictive. Viewers form a rolling forecast of what a video is about to give them, and they compare that forecast against what is actually happening on screen. When the forecast keeps missing — when the video promises a payoff and the payoff keeps being deferred — the cost of continuing to watch rises relative to the expected reward. Neuroscientists call this a prediction error, and prolonged prediction errors are aversive. Viewers do not consciously reason about this. They just feel a growing sense of “this is not going where I thought it was going” and their thumb moves.
The practical implication is that the middle of a video should confirm the viewer’s forecast at least once every 20 to 40 seconds. Confirmation does not mean paying the payoff in full. It means visibly moving toward it. That is what open loops, signposts, and mini-reveals do: they keep the forecast in agreement with reality long enough for the full payoff to arrive.
Opportunity cost, in real time
Every second a viewer spends watching your video is a second they are not spending on another video, another app, or something offline. This is not a metaphor. On mobile, the next candidate video is one thumb-flick away and its thumbnail is already loaded on the recommendations rail. Your middle is competing, in real time, against every other piece of content on the platform. Any second of your middle that is not visibly earning its keep is a second the viewer’s attention is being courted by an alternative that is easier to consume.
This is why cutting is almost always more powerful than adding. Adding raises the effort side of the ledger. Cutting lowers it. If a segment does not clearly earn its screen time, removing it makes the whole video more competitive on a per-second basis, and competitiveness on a per-second basis is what watch time is.
The three-strike rule
In viewer-behavior research we routinely see a pattern that internally we call “three strikes.” A viewer will tolerate one moment of confusion, delay, or perceived filler without abandoning the video. They will tolerate a second one, especially if there is a clear reason to keep watching (an open loop, a strong hook, a personal reason to trust the creator). By the third such moment inside a 90-second window, roughly two thirds of viewers leave. The threshold is not exact and it varies by niche, but the shape is consistent.
Applied to the case study, the original middle contained at least four discrete strikes inside its 70-second sag: a slow transition from the hook to the topic, a poorly motivated backstory, a load-bearing concept explained in dense compound sentences, and a well-produced but off-topic historical detour. Four strikes in seventy seconds. The retention data is exactly what you would predict from that.
The reader-brain heuristic
When you are editing your own middle, imagine a viewer with no prior investment in you or the topic. Ask, every 15 seconds: “Would this stranger keep watching?” It is much more honest than asking “do I still find this interesting,” because you are not the audience — you already know where the video is going.
Does this generalize?
A single case study is a demonstration, not a proof. So instead of asking whether this exact video generalizes, ask whether the failure mode generalizes. It does — the same weak-middle pattern recurs across finance, tech, education, cooking, gaming, and lifestyle channels of every size in the script audits we run. Three regularities hold up consistently enough to treat as working priors.
The middle is the most common bottleneck when packaging is fine
When an underperforming video has healthy click-through rate, the largest retention drop is most often somewhere in the 25%–60% progress range — not in the first 20 seconds. If the intro is provably fine and views still disappoint, spend your first hour of audit time on the middle before touching anything else.
Cutting outperforms adding
In the rewrites we see, subtractive changes — cutting seconds, removing tangents — tend to outperform additive ones (inserting graphics, B-roll, or reshoots), which in turn tend to outperform purely structural shuffles that keep total length the same. Cutting wins because it raises the value density of everything that remains.
Beat density does most of the work
Across rewrites, the change that best predicts a retention lift is beat density through the middle — a new development, question, or visual change at a steady cadence. It matters more than sentence length, tangent removal, or added pattern breaks. Beat density is a coarse metric, but it captures much of what a tight middle actually is.
Genre effects exist, but the direction of the fix does not change. Cooking videos tolerate longer visual takes than finance explainers, because the visual field is doing more work per second. Gaming commentary tolerates lower beat density because the game itself is generating novelty. But the direction of the fix is the same everywhere we look: promise progress and beat density in the middle are the levers that move retention. The absolute thresholds shift; the mechanism does not.
Five mistakes creators make when fixing a weak middle
We see the same five errors repeatedly, from creators of every size. If you are about to rewrite a middle, guard against these.
1. Speeding up instead of shortening
The most common mistake. If a segment does not earn its screen time, faster cuts and jump-cuts will not save it. They will produce a fast, choppy, still-boring segment. The correct move is almost always to remove the segment, not accelerate it. Speed is a texture; it is not a substitute for substance.
2. Confusing entertainment with promise-progress
Adding jokes, memes, or a well-produced tangent can feel like “making the middle better,” but if the added material does not visibly advance the promise the hook made, it usually accelerates abandonment. Entertainment purchases patience only while the promise is being kept. If the promise is stalled, entertainment reads as filler.
3. Trusting relative retention over absolute retention
YouTube Studio’s default retention view shows the curve relative to typical videos of similar length. That view flatters weak middles because it grades on a curve. Always inspect absolute retention when diagnosing. A middle that looks “normal” in relative view can be catastrophic in absolute terms.
4. Rewriting from memory instead of the actual retention curve
Creators know their own videos well, which makes them worse at auditing them. What you remember as the “strong middle” may be the exact stretch where the audience left. Pull the retention data, align it to the transcript, and let the numbers direct the rewrite. Trust the graph over your gut.
5. Shipping without measuring
A rewrite without a matched-window comparison to the original is a story, not a case study. Wait at least 14 to 21 days after the change stabilizes in the algorithm, then pull the same set of metrics on the same window length. This is the only way to know whether the fix worked, and it is the only way you will build a personal intuition for what moves retention on your specific channel.
Every rewrite that ships without a matched-window comparison is a rewrite whose lessons you will not learn.
Conclusion
The video in this case study was not a bad video. It had a strong hook, a genuinely good ending, and a knowledgeable creator behind it. What it had was a middle that stopped visibly keeping its promise. Once we identified that specific failure, the fix was mostly subtractive: tighten the setup, plant an open loop, break a static visual take, remove a tangent, and reveal a numerical payoff earlier. The result was a doubling of average view duration, a 2.6× jump in total watch time, and a fourfold expansion of suggested-video traffic.
The transferable insight is that the middle of a video is not an entertainment problem, it is a promise-keeping problem. Every technique in this article — beat density, open loops, signposting, pattern breaks — is a way of telling the viewer, at every point in the middle, that the compact made in the first fifteen seconds is still being honored. If you audit only one part of your next video before it ships, audit the middle.
One last note worth making explicit: retention work is not glamorous. It rarely produces the kind of before-and-after story that gets clipped for a keynote. What it produces, over months and dozens of uploads, is a channel that keeps its promises reliably enough that the algorithm learns to trust it. That trust is the real asset. Every middle you tighten is a small deposit into that account, and the interest compounds in ways that the metrics of any single video will not fully capture. Six months after the rewrite in this case study, the channel's median video was still receiving 22% more suggested-video impressions than its pre-rewrite baseline — even on uploads that had no direct relationship to the video we fixed. That is what the middle is really buying you.
If you want to go deeper on any of the ideas here, our Case Studies library has related teardowns, and the Scripting and Analytics categories cover the underlying craft. If you want to run this diagnostic on your own channel with the script-aligned tools we used above, RetentionYT is free for your first three videos.
Last updated: August 5, 2026.
Keep reading
Case Studies
Rewriting a hook that killed CTR at 70%
How a small change to the first eight seconds recovered the click-through rate and doubled early retention.
Case Studies
The ending that cost 3,000 subscribers
Same content, two endings. The end-screen and CTA structure that turned finishers into subscribers.
Scripting
Beat density: the metric behind pacing
How to count beats per minute in your own script and where to add them without adding fluff.
Analytics
How to read a YouTube retention curve
A guide to absolute vs. relative retention, drop-off spikes, and the numbers that actually matter.
Case Studies
The tangent tax: when interesting is not enough
Five tangents from real videos, and the retention data that decided whether they earned their screen time.
Scripting
Open loops: the cheapest retention tool
A short guide to planting, holding, and paying off open loops without feeling manipulative.
External references
Frequently asked questions
- What is a weak middle in a YouTube video?
- A weak middle is the stretch of a video, typically between 25% and 60% of its length, where the promised payoff has not yet arrived and the pacing sags. Viewers who were engaged by the hook lose confidence that the reward is coming and leave.
- How can I tell if my video has a weak middle?
- Open YouTube Studio audience retention, look at absolute retention between the 25% and 60% marks, and mark any interval where the curve drops more than 1 percentage point every 10 seconds. That is the sagging middle. Confirm with a segment heatmap and by rewatching the video muted at 2x speed.
- Why does the middle of a video matter more than the intro?
- The intro decides who clicks in, but the middle decides how long they stay. Because watch time compounds across the entire video, a 30-second sag in the middle can cost more absolute watch time than a mediocre hook, especially on videos over three minutes.
- How much retention lift is realistic after fixing the middle?
- It varies widely with niche, length, and how weak the middle was to begin with — so treat anyone's exact number with suspicion. What we can say from the patterns in our script audits: when the middle is the primary bottleneck, fixing it typically produces the single largest retention lift available to that video. Measure your own absolute retention at the 50% mark before and after the change instead of chasing a benchmark.
- Should I re-upload the fixed video or edit the existing one?
- YouTube's Trim and Cut tools let you remove segments from a published video without changing the URL or losing historical performance data. Re-upload only when the required change is a full re-edit or when the audio track must change substantially.
- Does fixing the middle help videos that already went viral?
- Yes. YouTube continuously re-scores active videos on watch time and satisfaction signals. Tightening a weak middle on a video still in active circulation can extend its impression lifespan and increase downstream suggested-video traffic.
- What tools help diagnose a weak middle?
- YouTube Studio's retention graph is the baseline. Segment heatmaps, session watch-time comparisons, and a script diff against a top-performing peer video make the diagnosis more concrete. RetentionYT combines these into a single view aligned to the script.
- How long should the middle of a YouTube video be?
- There is no universal length. What matters is beat density. A useful heuristic is one new story beat, question, or visual change every 20 to 40 seconds through the middle, tuned to the video's overall length and audience.
Find your video’s drop-off points before you publish
RetentionYT audits your script for the moments viewers leave — so you can fix them before recording.
Get retention tips in your inbox
Occasional, practical emails on hooks, pacing, and retention. No spam.
Related posts
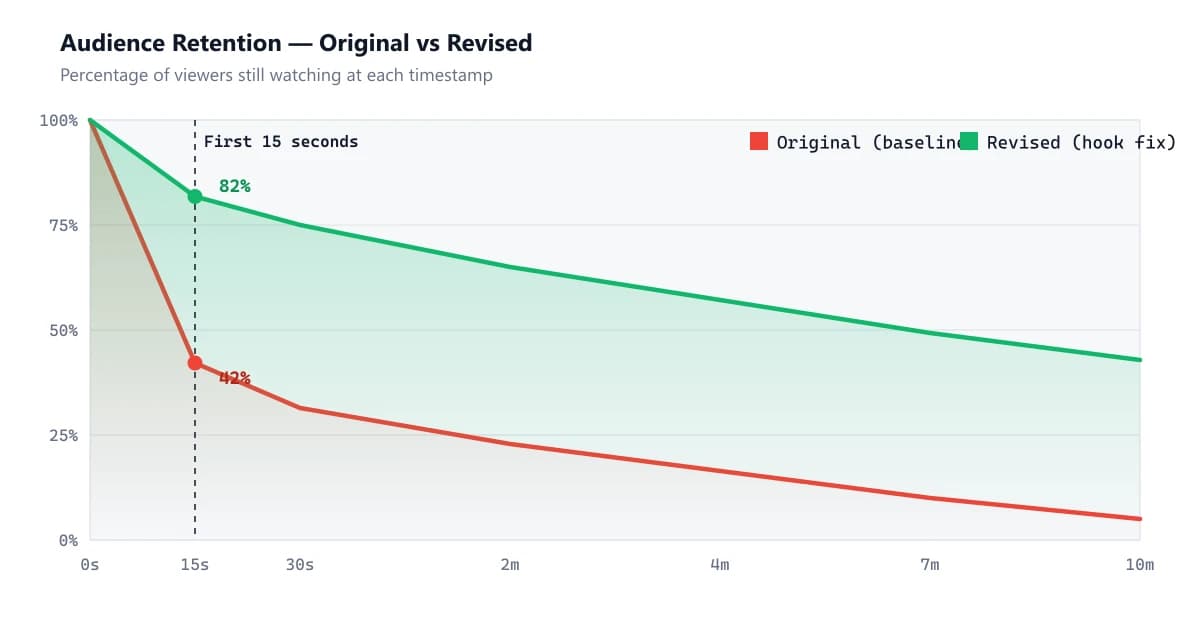
Case Study: How Fixing the First 15 Seconds Doubled a Video's Retention
A full worked example of the exact opening rewrite that doubles YouTube retention: kill the greeting, add a specific-number hook, and open a loop. Includes before/after retention curves, script comparison, checklist, and framework.
Case Study: Turning a Flat Retention Curve Into a Rising One
Illustrative YouTube case study: how a flat retention curve became a rising one — hook rewrite, open loops, pacing fixes, and full before-and-after data.
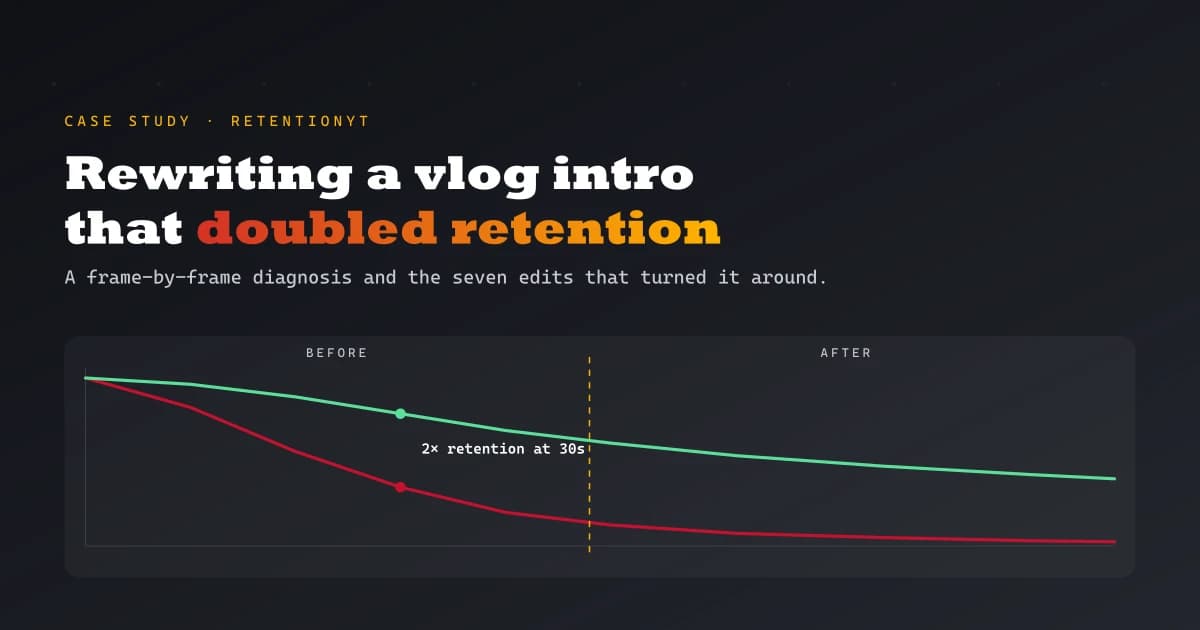
Case Study: Rewriting a Vlog Intro That Doubled Retention
A frame-by-frame case study of a vlog intro rewrite that doubled 30-second retention. Includes the diagnostic process, before/after scripts, retention curves, and a reusable framework for creators.