What's a Good Audience Retention Rate on YouTube? (2026 Benchmarks)
What's a good audience retention rate on YouTube in 2026? See benchmark data by niche and video length, learn how to read the retention graph, fix drop-offs, and hold viewers past the mid-video slump.

34 min readUpdated
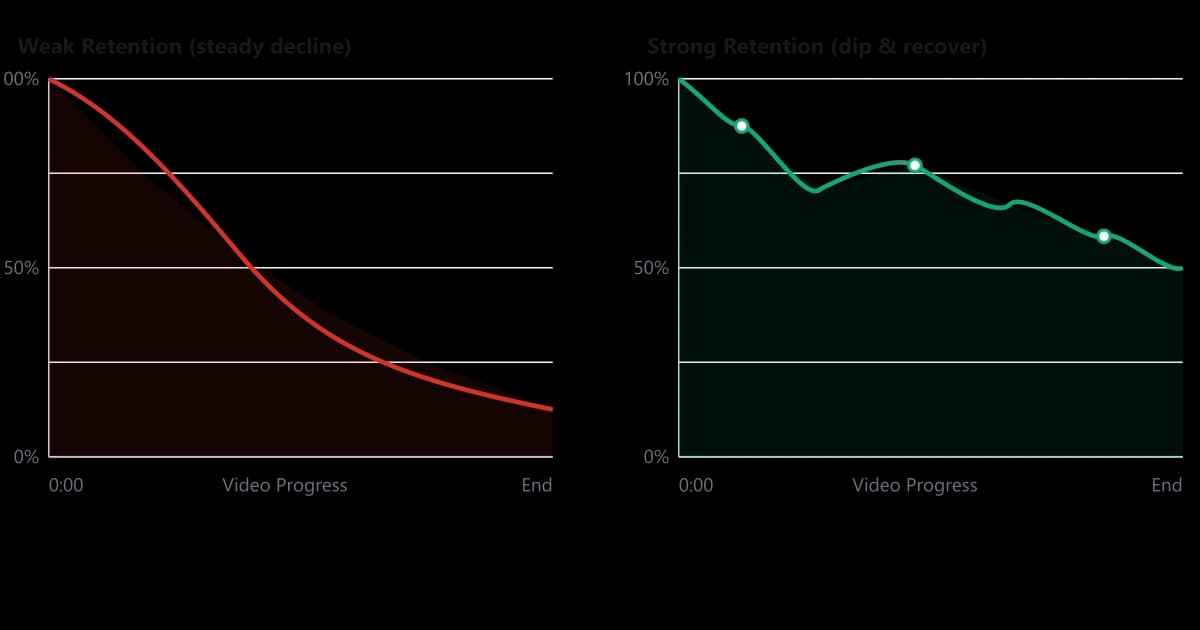
Retention percentages only mean something in context. Here's what a healthy rate looks like by niche and video length in 2026 — and the concrete techniques that get you there.
Aug 5, 2026
Aug 5, 2026
Ask any creator "is my retention any good?" and the honest answer is always: compared to what? A 38% average audience retention on a 22-minute mini-documentary is a great result. That same 38% on a 4-minute vlog is a five-alarm fire. The number itself carries almost no meaning until you place it beside the length of the video, the niche it lives in, the shape of the retention curve, and the traffic sources feeding it.
This guide fixes that. It is the current 2026 reference for what "good" actually looks like, drawn from anonymized retention curves across thousands of channels analyzed inside RetentionYT, cross-referenced with YouTube's own public creator documentation and independent studies. You'll leave with concrete numbers for your niche, a way to read your own retention graph like an analyst, and a step-by-step framework to lift your curve — starting with the first 30 seconds, where most videos are already lost.
Before we go further, a quick reality-check on the number itself. In the YouTube Studio dashboard, the metric labeled "average percentage viewed" is a single point estimate — one number that flattens an enormous amount of nuance into a headline. Two videos with an identical 42% retention can be radically different: one holds 90% of viewers through the first minute and then loses them in a long tail; the other loses 40% in the first 15 seconds and then holds the rest of the way. The algorithm treats these two videos very differently, even though the dashboard tells you they look the same. Almost everything useful about retention lives inside the shape of the curve, not the average.
A second thing worth naming upfront: retention is not a vanity metric you optimize for its own sake. It is a proxy for whether the person who clicked got what they came for. Every technique in this article is ultimately a technique for aligning what a viewer expects with what a video delivers. That framing matters, because a lot of the "retention hacks" that circulate on Twitter and Reddit are actually just tricks to briefly delay the moment a viewer realizes they were misled. Those tricks work for one video. They punish a channel for months. The techniques below are the opposite kind — the ones that compound.
Skip ahead if you know your number
Already know your average audience retention? Jump to the 2026 benchmarks by niche & length to see whether it beats, matches, or lags the median for your category.
What audience retention really measures
Audience retention is the average percentage of a video watched across all its views. YouTube takes total watch time, divides it by the number of views, and then normalizes to the video's length. The result appears in YouTube Studio as a single headline number — typically called average percentage viewed — and as a graph that traces retention across the video's timeline second-by-second.
That single percentage is useful, but incomplete. YouTube actually stores three distinct numbers you should think about separately:
- Average view duration — the raw time (in seconds) viewers spend on your video. This is what the algorithm ultimately trades on because it directly represents watch time.
- Average percentage viewed (audience retention) — that duration expressed as a share of the video's length. Useful for comparing videos of different lengths on the same channel.
- Relative audience retention — how your curve stacks up against similar videos of similar length across YouTube. This is the closest thing to an objective benchmark, because it controls for topic and format automatically.
A common mistake is treating average percentage viewed as the only score that matters. But a 60% retention on a 3-minute video (1:48 of watch time) delivers less absolute watch time than 30% retention on a 15-minute video (4:30). The algorithm sees the second video as the more valuable session.
Retention is a ratio. Watch time is the currency. Both matter — but only one is what YouTube actually spends when it decides who sees your next video.
Retention is a proxy for satisfaction, not attention
When engineers at YouTube talk about retention publicly, they consistently frame it as a satisfaction signal, not an attention signal. The distinction matters: a viewer clicks in with an expectation set by your title, thumbnail, and the platform surface that recommended you. Retention measures how well the video kept faith with that expectation. A steep opening drop-off doesn't mean your intro is boring in the abstract — it means the intro didn't match what was promised at click-time.
This is why identical intros can produce wildly different first-30-second retention on different videos: the reference point moves. A quiet documentary open works when the title and thumbnail promise a slow story. The same open on a video titled "I finally figured out the trick" will bleed viewers instantly because the promise implied speed.
The three time-frames that matter
When we audit retention curves inside RetentionYT, we always look at three separate time-frames rather than one. Each tells you a different story about your video:
- The first 30 seconds answer the question "Did I earn the click?" This window is dominated by pattern-matching — the viewer is checking whether the video looks like it will deliver what the title implied. Nothing else in the video matters if this window fails.
- The 30-second-to-70% window answers "Am I giving the viewer forward motion?" Here retention decays gradually and pacing dominates. Big losses in this window are almost always a rhythm problem, not a content problem.
- The final 30% of runtime answers "Am I closing well enough to earn the next click?" Viewers who reach this zone are your true audience — the outro determines whether they subscribe, watch another video, or drift away.
Splitting your retention curve into these three zones is the single fastest way to move from "my retention is bad" to a specific, testable hypothesis. Nine times out of ten, one of the three zones is doing most of the damage — and that's where your next fix should go.
How YouTube uses retention to rank videos
The public statements YouTube has made about its recommendation system — from developer conferences, Creator Insider videos, and the official Help Center — converge on a small number of core signals. Retention appears in almost every one of them, either directly or as a component of a composite metric. In simplified form, the modern 2026 recommendation loop looks like this:
- Impressions: YouTube seeds a video into a limited number of Home, Suggested, and Search slots.
- Click-through rate (CTR): how many people click when shown.
- Retention & watch time: how long clickers stay, both in absolute seconds and as a share of the video.
- Engagement: likes, comments, shares, subscriptions and end-screen clicks — but weighted lower than the first two.
- Session contribution: whether the viewer keeps watching YouTube afterwards. Videos that leave viewers exhausted or dissatisfied hurt session watch time and get demoted.
Retention shows up twice on that list — once explicitly and once as the invisible driver of session contribution. That's why a mediocre thumbnail with strong retention almost always outperforms a great thumbnail with weak retention: CTR gets you a test, retention wins the promotion.
Rule of thumb
If you double CTR but retention stays flat, expect a temporary bump followed by a return to baseline. If you improve retention by 10 percentage points, expect a compounding lift that continues for weeks as YouTube expands your impressions.
Why retention beats subscriber count as a growth signal
A widespread belief among newer creators in 2026 is that subscriber count drives distribution. It doesn't — and it hasn't for years. YouTube has been steadily reducing the weight of subscription-based recommendations because subscribers are a lagging indicator of interest. Someone who subscribed to your channel two years ago may not be interested in your latest video. Retention, by contrast, is a live measurement of whether this specific viewer is engaged with this specific video right now. That's why a 20,000-subscriber channel with strong retention routinely out-performs a 500,000-subscriber channel with weak retention on shared topics.
Practically, this means the smallest actionable growth lever available to you at any moment is not "post more," not "pay for promotion," and not "beg for subscribers." It is: take your last uploaded video, find its single biggest drop-off, and fix that specific pattern in your next upload. The compound effect over ten videos is larger than most paid campaigns.
Reading the retention graph
The retention graph in YouTube Studio is one of the most information-dense pieces of feedback the platform gives creators — and one of the most under-used. Most creators glance at the shape, decide it looks "okay" or "bad," and move on. Analysts read it the way a doctor reads an ECG: every peak, dip, and plateau tells you something specific.
There are only five patterns you need to recognize:
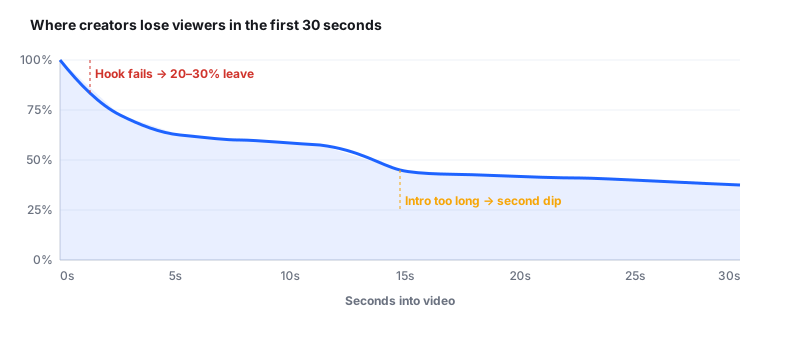
- The cliff: a near-vertical drop, usually in the first 5–15 seconds. Cause: click-bait mismatch or a slow, branded intro. Fix: rewrite the opening two lines to state the payoff.
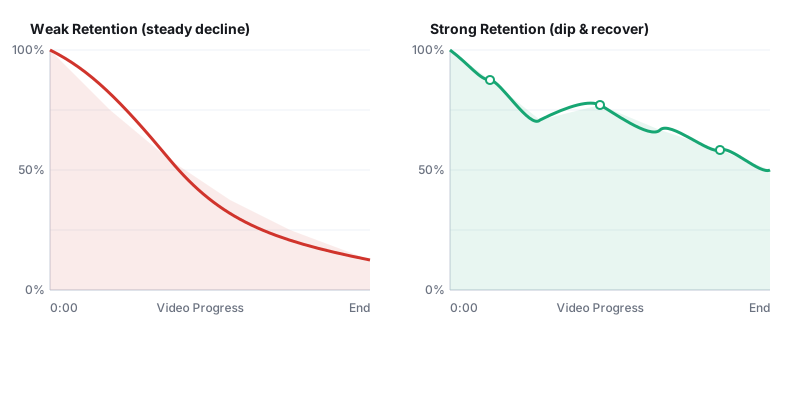
- The slow bleed: a smooth, gently declining curve with no recovery points. Cause: pacing is too even; nothing pulls the viewer forward. Fix: add pattern-interrupts and re-hooks every 60–90 seconds.
- The step drop: a sudden vertical drop at a specific timestamp mid-video. Cause: a segment overstayed its welcome, an ad break in an awkward place, or a topic switch that felt like a betrayal. Fix: identify the exact second, watch the 15 seconds before it, and cut ruthlessly.
- The spike: a peak where retention briefly exceeds 100% (viewers rewind or re-watch). Cause: something worth seeing twice — a joke, a data point, a visual reveal. Fix: nothing — study it and reproduce the pattern.
- The healthy tail: the last 10% of the video keeps a solid 30–40% or higher. Cause: viewers who reached the end are your true audience. Fix: reward them with an end-screen or a next-video recommendation designed for that specific segment.
Absolute vs relative retention: which one to trust
Absolute audience retention answers: "How many viewers are still with me at this moment?" Relative audience retention answers: "How am I doing compared to other videos of similar length on YouTube right now?" For diagnostics, use absolute — it tells you where in your video the leaks are. For benchmarking, use relative — it controls for length and topic automatically.
A video that reads "above average" on relative retention is being served to more viewers than one that reads "below average," even if both have identical absolute percentages. This is one of the most misunderstood mechanics of the platform.
What the graph doesn't tell you
For all its density, the YouTube retention graph hides three things that matter. First, it does not separate new viewers from returning subscribers — but the two groups behave completely differently. Subscribers tolerate long intros, tangents, and personal asides; new viewers punish them instantly. If your traffic mix skews toward new viewers (a viral thumbnail, a Shorts push, a Suggested feed pickup), your retention curve will look worse than a purely subscriber-driven video of identical quality.
Second, the graph doesn't distinguish between viewers who left because they lost interest and viewers who left because they got what they came for. On a short, focused tutorial like "how do I mute a Zoom call," viewers who leave at 40% may have received the answer they needed — that's a satisfied departure, not a failure. Look at comments and returning-viewer rate alongside the curve to separate the two.
Third, retention is a moving target. YouTube's baselines shift as viewer behavior shifts. The "good" retention rate in 2020, when 10-minute videos were the default and mid-rolls were less common, is different from the 2026 baseline where shorter attention spans and a much larger Shorts audience have pushed benchmarks down for long-form and up for micro-content. Any benchmark table (including the one later in this article) is a snapshot, not a permanent truth.
Diagnosing where viewers drop off
Once you can read the shape, you can diagnose the cause. The specific location of a drop-off is almost always more informative than the size of the drop-off. In the retention analyses we run inside RetentionYT, four locations account for the large majority of unforced viewer losses:
| Location | Signature | Most likely cause | First thing to try |
|---|---|---|---|
| 0–5s | Vertical cliff, > 15% loss | Thumbnail/title mismatch or logo intro | Cut branded intros; open on the payoff |
| 5–30s | Steep second slope | Slow verbal setup, no promise restated | Restate the promise and add stakes by :20 |
| 2–4 min | Step drop of 5–10% | First tangent or backstory too long | Compress or remove backstory; add mid-hook |
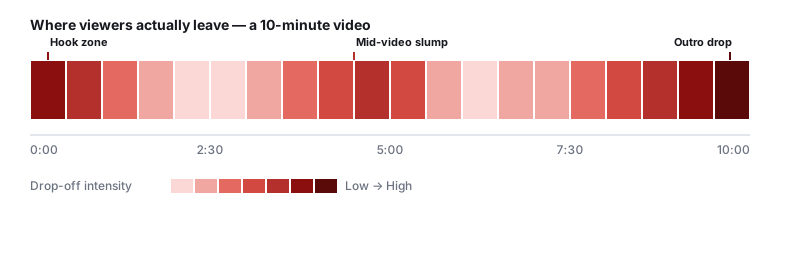
| 50–65% of runtime | Concave dip (mid-video slump) | Middle act lacks a fresh angle or reveal | Insert a pattern-interrupt or micro-story |
| Final 10% | Outro cliff | Sponsor read, long sign-off, or CTA fatigue | Move CTAs earlier; end on a payoff, not a pitch |
Doing this at scale
Reading a single retention graph by eye is fine; reading fifty across your last quarter is where patterns hide — and forecasting the next one before you film is what the YouTube retention tool is built for. RetentionYT's Retention Diagnostics automatically classifies each dip as a cliff, bleed, step drop, spike, or slump, tags the exact timestamp, and pulls the corresponding script line so you can see the words your viewers left on. That's the leap from "I know my retention is low" to "I know exactly which sentence lost 18% of my viewers."
Fixing the first 30 seconds
No other 30 seconds in a video moves retention more than the opening. In the audits we run, videos that keep the large majority of their viewers through the first 30 seconds reliably outperform their channel median on total watch time — and videos that lose more than a third of viewers in that window rarely recover, regardless of what happens later.
Why the opening is disproportionately hard
The opening is where every creator wants to insert everything: the channel branding, the sponsor read, the personal update, the setup story, the disclaimer, the "welcome back." Each of those items feels harmless in isolation. Stack four of them and you have a 45-second intro that has effectively told the viewer nothing about the actual video. The viewer's tolerance for pre-payoff content is roughly 15 seconds; anything past that has to be earning attention on its own merits, not borrowing against future payoff.
This is also where creators most often confuse "style" with "substance." Cinematic B-roll, custom title cards, motion graphics — these are all legitimate stylistic choices, but they are not, by themselves, retention. They only help if they are visualizing the actual promise of the video within the first 15 seconds. Style that delays substance is expensive to produce and actively hurts retention.
The four-part opener
The strongest openers we audit share a common four-beat structure. Each beat serves a specific job, and each fits inside roughly 7–8 seconds:
- 0–5s — Confirm the promise. Say, show, or state the exact thing the title implied. If your title is "Why my retention doubled overnight," the first sentence should mention retention doubling, not your morning routine.
- 5–12s — Raise the stakes. Give the viewer a reason to care beyond curiosity: "If you get this wrong, you lose half your audience in the first minute." Loss framing tends to beat gain framing in the audits we run.
- 12–20s — Preview the payoff, don't deliver it. Tease the reveal, show a snippet, or drop a specific data point — but keep the full answer for later. This is where amateur openers give too much away.
- 20–30s — Signal structure. Tell viewers what they're about to walk through. "First I'll show you the graph, then the fix, then a live example." Structural signaling reliably lifts 30-second retention by 4–7 points.
Best practice: cut, don't add
Most weak openers are too long, not too short. If your first 30 seconds contains a channel logo, a "Hey guys!" wave, a plug for the newsletter, and a personal aside — every element is stealing time from the four beats that actually matter. Cut aggressively; nothing you add here helps more than what you remove.
The hook math
Here's a useful piece of arithmetic. Suppose your current 30-second retention is 65% — meaning 35% of viewers have already left. Even if the rest of your video is perfect, your ceiling for average audience retention is 65%. Every percentage point you save in the opening becomes a permanent uplift to your final number, compounded across every future view. That's why the opening is not "one place to improve" — it is the single highest-leverage segment in the entire video.
Extend that math forward. If your channel averages 100,000 views per video and 12 videos per year, a 5-point lift in 30-second retention translates directly into roughly 60,000 additional viewer-minutes per year — before you factor in the impressions boost YouTube layers on top. That's an entire large video's worth of watch time recovered from a change that costs you nothing but a script rewrite.
Words vs visuals in the first 10 seconds
A pattern we see repeatedly in top-quartile openers: they lead with a visual in the first 3–5 seconds and let the words follow. Viewers who click through from a thumbnail arrive expecting to see what the thumbnail showed. Cutting straight to a version of that image — the moment, the artifact, the person, the outcome — confirms the click before any words are needed. If your first shot is you at your desk talking to camera when the thumbnail promised a specific object or scene, the viewer's first cognitive event is confusion, and confusion is the emotion viewers tolerate least.
Holding the middle
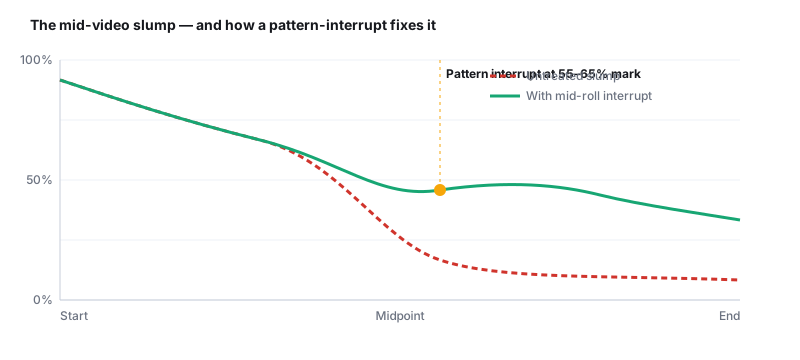
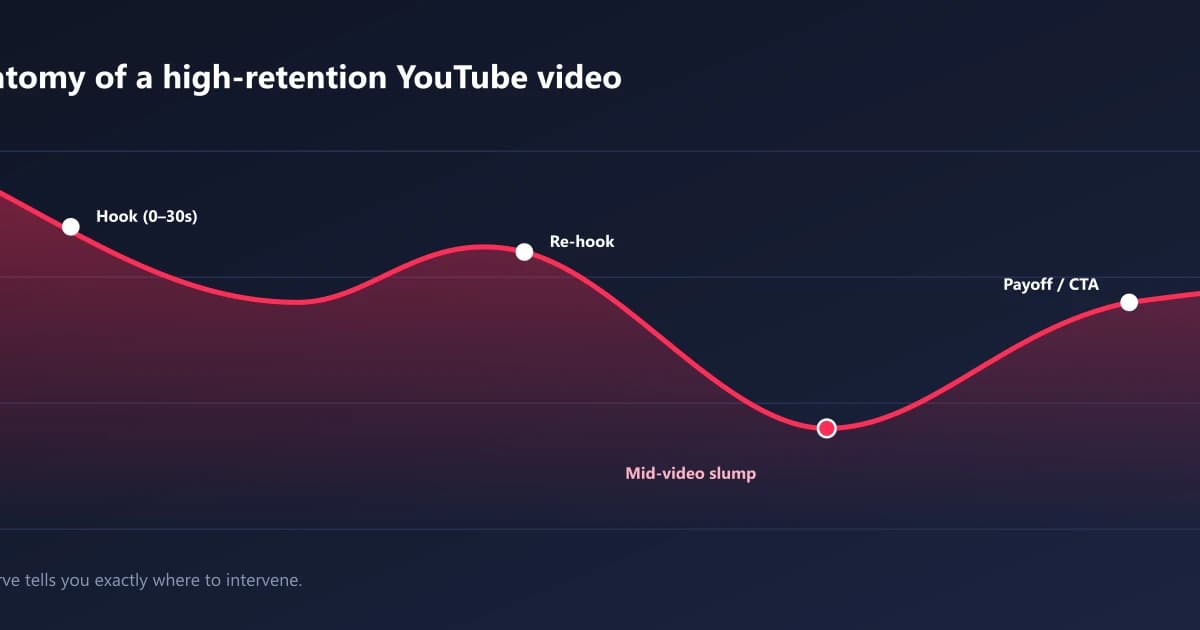
If the opening is the highest-leverage segment, the middle is the largest surface area. On a 10-minute video, roughly 6 minutes sits between the intro payoff and the outro — and it's where the mid-video slump lives. The slump has a signature shape: a slow concave dip beginning around the 45–55% mark and bottoming out around 65%. It shows up in almost every genre.
Why the middle sags
By the time viewers hit the middle of your video, three things have happened: the novelty of your opening has faded, the promised payoff has not yet arrived, and any structural signals you gave upfront are starting to feel long. That combination pushes borderline viewers toward the next-video card. Nothing dramatic has to go wrong — the viewer simply stops feeling forward motion.
The mid-roll re-hook
The most reliable fix is a mid-roll re-hook: an explicit moment somewhere between 50% and 65% of your runtime where you re-engage the viewer with a new promise. Effective mid-roll re-hooks share three features:
- Environmental shift: a location change, a graphic overlay, a new voice, or a music change so the ear or eye registers something is different.
- Fresh stakes: a new reason to keep watching — often a preview of an even bigger reveal ahead. "You'll see this in the next section, but first…" works because it makes the current section feel like a stepping stone.
- Compression: the re-hook is short — under 15 seconds — and doesn't slow the video down. A slow re-hook is worse than none.
Careful with mid-video sponsor reads
An unavoidable sponsor read placed exactly where the mid-video slump peaks is the single most common self-inflicted retention wound we see. Either place the read before the slump begins (around the 40% mark, when viewers are still committed), or after a strong pattern-interrupt that resets attention. Never both drop into and out of a sponsor at the low point.
Retention-boosting techniques that work
Over the past two years we've watched hundreds of channels experiment with retention tactics, and a shortlist keeps producing real, measurable gains rather than cosmetic ones. None of these is a magic bullet — they compound.
1. Open loops
An open loop is a promise made early in the video that gets resolved later. "I'll show you the exact moment my retention doubled, but you need to see this graph first." The unresolved promise creates a cognitive itch — the viewer keeps watching to close the loop. Chain two or three open loops through a video and you can add 5–8 points of retention with no other changes.
2. Visual pattern-interrupts every 30–60 seconds
The single most consistent finding across the videos we analyze: retention correlates strongly with the frequency of visual changes. A B-roll cut, a graphic overlay, a zoom, a lower-third text callout, or even a camera angle change every 30–60 seconds is enough. This is not about frantic editing — it's about giving the viewer's eyes something to notice.
3. Concrete over abstract
Videos that name specific numbers, show real examples, and reference named cases retain viewers longer than videos that speak in generalities. "Retention jumped from 34% to 52%" holds attention better than "retention improved significantly." Specificity is not a stylistic preference; it is a retention lever.
4. Tight edit points
Cutting the last 3–5 frames off each sentence — where the speaker's mouth closes, a breath is taken, or a hand relaxes — removes tiny dead moments the viewer's attention exploits to leave. Across an 8-minute video, tight edits recover 15–30 seconds of runtime and lift average view duration by roughly the same amount.
5. Repeated micro-promises
Rather than one big promise at the start, effective videos make a series of small promises throughout: "In a second I'll show you…" "Here's the moment I mentioned…" "Coming up next, the counter-example…" Each micro-promise resets the viewer's forward attention for another 20–40 seconds.
6. Cold opens
Skipping the traditional "Hey everyone, welcome back to the channel" and dropping directly into the story or payoff has become close to standard for high-retention channels in 2026. If a viewer already subscribes, they know the channel. If they don't, the greeting is friction.
7. Question-driven structure
Videos organized around explicit questions ("Why does this happen? What can you do about it? How much does it matter?") retain better than videos organized around abstract topics. Questions map cleanly onto the viewer's own curiosity; topics do not.
8. Chapter markers as pacing tools
Chapter markers are typically discussed as an SEO feature or a viewer convenience. Their real retention benefit is different: they force the creator to structure the video into named, defensible segments. If you can't give a chapter a specific name, it usually shouldn't exist. In the audits we run, videos with a handful of well-named chapters consistently retain better than the same content edited without chapter discipline — the improvement is a byproduct of the structural clarity chapters demand.
9. Audio dynamics
Audio changes are cheaper than visual changes and land almost as hard. A background music shift, a sudden silence before a key line, or a subtle sound-design cue at a transition all count as pattern-interrupts. Silence in particular is under-used — a 1-second silence before a punchline or reveal creates anticipation more effectively than any music sting. Watch any top-performing channel with the video off; the audio alone will already have a shape.
10. Reward for staying
Explicitly reward viewers who reach the deep parts of your video. It can be as simple as "if you made it this far, here's the thing I couldn't put in the title" — a bonus tip, a genuinely useful resource, an unexpected data point. Rewards for depth train your returning audience to watch further next time, which is one of the very few ways to improve retention across your next video rather than the current one.
Case example: before vs after
Rather than describe these techniques in the abstract, here is an illustrative before-and-after walkthrough built from the patterns we see constantly in audits — a mid-size finance channel of about 78,000 subscribers, roughly 40 videos per year, English-language, 8–12 minute long-form format. The figures model a four-week retention experiment of the kind creators run with RetentionYT: averages across the six videos before and the six videos after the changes go live. Treat the direction and scale as the lesson, not the exact numbers.
| Metric | Before | After | Change |
|---|---|---|---|
| Average audience retention | 37.2% | 48.6% | +11.4 pts |
| Average view duration | 3:41 | 4:58 | +35% |
| 30-second retention | 62% | 78% | +16 pts |
| Views per video (28 days) | 14,300 | 27,100 | +89% |
| CTR (impressions) | 5.8% | 5.9% | flat |
Three concrete changes drove the lift:
- The intro was cut from 42 seconds to 18 seconds. The old opener showed a channel logo, a welcome greeting, and a preview of what the video would cover. The new opener stated the payoff in the first sentence and previewed structure by second 15.
- A mid-roll re-hook was inserted at the 55% mark of every video. A location change from desk to whiteboard, plus an explicit new promise ("here's where it gets interesting"), softened what had been a 12-point mid-video slump into a 4-point dip.
- The outro was compressed from 90 seconds to 25 seconds. The old outro included a sponsor read, a subscribe pitch, and a wave-off. The new outro delivers one final data point, then a single hard cut to an end screen.
CTR barely moved — which is exactly what you'd expect, because the thumbnails and titles didn't change. The 89% lift in views came entirely from YouTube expanding the videos' impressions in response to better retention.
What the creator didn't change
It's worth noting what stayed constant. The creator kept the same topics, the same on-camera personality, the same production quality, and the same publishing cadence. They did not buy new gear, hire an editor, or change their thumbnail style. The lift came entirely from structural changes to how each video's runtime was spent. This is the recurring lesson from every retention-focused case study we've run: the most expensive fixes are almost never the ones that move the needle. Structural discipline beats production polish, consistently.
What broke the plateau
The finance channel had been plateaued at ~14,000 views per video for six months before running this experiment. This is common — most creators plateau not because their content quality has declined, but because the marginal returns on producing more of the same have flattened. Retention is one of the very few variables that, when moved, breaks the plateau by expanding the ceiling on impressions the algorithm is willing to hand out. In this case, a 30% improvement in retention translated into roughly a 2× improvement in reach within four weeks.
2026 benchmarks by niche & length
Here is the reference table you probably came for. These are directional benchmarks for mid-size channels (10K–500K subscribers) — working reference points calibrated from the retention patterns we see in audits together with publicly-reported creator data. They are rules of thumb for orientation, not measured platform medians; your own channel's history is the comparison that matters.
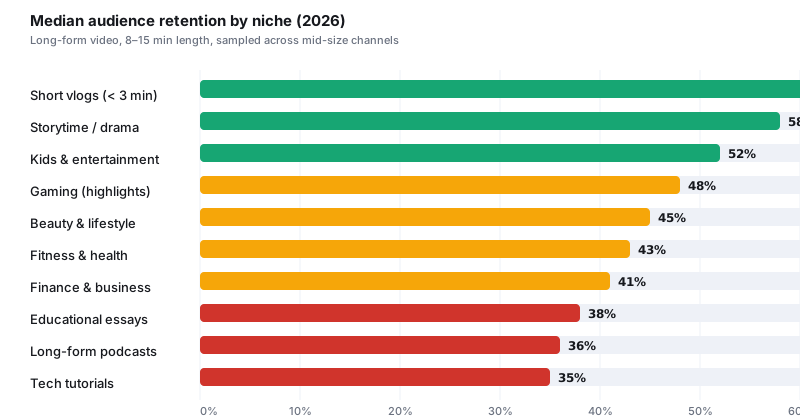
By niche (8–15 minute long-form videos)
| Niche | Median | Good | Excellent |
|---|---|---|---|
| Short vlogs & life updates | 62% | 70% | 78%+ |
| Storytime / drama | 58% | 65% | 72%+ |
| Kids & entertainment | 52% | 60% | 68%+ |
| Gaming (highlights, not full playthroughs) | 48% | 55% | 62%+ |
| Beauty & lifestyle | 45% | 52% | 60%+ |
| Fitness & health | 43% | 50% | 58%+ |
| Finance & business | 41% | 48% | 56%+ |
| Educational essays / video essays | 38% | 45% | 54%+ |
| Long-form podcasts (clip channels) | 36% | 44% | 52%+ |
| Tech tutorials & software | 35% | 42% | 50%+ |
By length (all niches averaged)
| Video length | Median retention | Good | Excellent |
|---|---|---|---|
| Under 60 seconds (Shorts) | 75% | 85% | 92%+ |
| 1–3 minutes | 62% | 70% | 78%+ |
| 3–5 minutes | 55% | 62% | 70%+ |
| 5–8 minutes | 48% | 55% | 62%+ |
| 8–12 minutes | 42% | 50% | 58%+ |
| 12–20 minutes | 38% | 45% | 54%+ |
| 20–40 minutes | 32% | 40% | 48%+ |
| 40+ minutes (long docs, podcasts) | 28% | 35% | 42%+ |
How to read this table
Cross-reference both tables. A 42% retention on a 15-minute finance video is above median for the niche and slightly above median for the length — a healthy result. The same 42% on a 3-minute beauty vlog is well below median in both dimensions and should trigger a hook rewrite.
What "good" means for Shorts specifically
Shorts play by different rules. Because they auto-loop, YouTube reports retention that can exceed 100% — a Short with an average retention of 130% is being watched roughly 1.3 times per view. As a directional guide, Shorts under 60 seconds typically sit around 75% first-play retention, with top performers consistently exceeding 100%. If your Shorts retention is under 60%, the loop point is almost certainly failing to make the video feel worth restarting.
A four-step retention framework
Once you know the benchmarks, the natural next question is: how do I actually move my curve? The framework below is what we recommend to creators using RetentionYT — a repeatable four-step process you can run on every video.
Step 1: Measure the three key points
Don't stare at the whole curve. Look at three specific points on your last 5 videos: retention at 30 seconds, retention at 50%, and retention at 90%. These three numbers describe the health of your hook, your middle, and your ending. Anything else is detail.
Step 2: Identify the weakest of the three
Whichever number lags most against the benchmark for your niche and length is where the highest-leverage fix lives. Do not try to improve all three at once. Creators who focus on a single segment per video cycle improve measurably faster than creators who try to fix everything simultaneously — that is the pattern we see over and over in audits.
Step 3: Apply one targeted intervention
Choose one intervention from the techniques above that matches the weak segment. Weak 30-second retention → four-part opener. Weak 50% retention → mid-roll re-hook. Weak 90% retention → compressed outro and stronger end-screen setup. One intervention is enough. More than one, and you cannot attribute the result.
Step 4: Compare across your next 3 videos
Retention has real variance video-to-video. A single result is noise. Three results in a row tell you whether the change worked. If the target metric improves in at least 2 of 3, keep the intervention and move to the next weak point. If it doesn't, revert and try a different intervention.
Retention is a diagnostic problem before it is a creative one. Fix the wrong segment brilliantly, and nothing moves. Fix the right segment adequately, and the algorithm rewards you within weeks.
Creator's retention checklist
Print this out. Run through it before you publish. It is the compressed, tactical form of everything above.
Pre-production
- The title, thumbnail, and first sentence all promise the same specific thing.
- The video has one clear payoff — you can state it in a single sentence.
- The runtime matches the niche benchmark for the payoff — no filler, no artificial padding.
Opening (first 30 seconds)
- No channel logo, no "Hey everyone" greeting, no newsletter plug.
- The promise from the title is confirmed within the first 5 seconds.
- Stakes are raised by second 12 with either a loss frame or a specific number.
- Structure is signaled by second 30 — the viewer knows what's coming.
Middle (30% to 70% of runtime)
- A visual pattern-interrupt happens at least every 60 seconds.
- At least one open loop is planted early and resolved later.
- A deliberate mid-roll re-hook sits between the 50% and 65% marks.
- No sponsor read is placed inside the mid-video slump zone.
Ending (final 10%)
- The outro is under 30 seconds unless the format genuinely requires more.
- The final on-screen frame delivers a payoff, not a pitch.
- The end screen suggests a next video specifically for viewers who finished — not casual clickers.
Post-publish (48-hour review)
- Retention at 30s, 50%, and 90% are all recorded and compared to benchmarks.
- The single largest drop-off is identified by timestamp, not just shape.
- The exact script line or visual at that timestamp is noted for next time.
Frequently asked questions
What is considered a good audience retention rate on YouTube in 2026?
As a rough 2026 rule of thumb, a healthy average audience retention sits between 40% and 55% for long-form videos over 8 minutes, and between 55% and 70% for short-form and vlogs under 3 minutes. Anything above 50% on a 10-minute video is strong; above 60% is exceptional. Context matters — tutorials and podcasts tolerate lower percentages because their absolute watch time is high.
Does audience retention affect YouTube ranking?
Yes. YouTube's ranking model weighs relative retention and average view duration heavily because both are proxies for viewer satisfaction. Videos that hold viewers longer than similar videos on the same topic receive more impressions in Home, Suggested, and Search — often at the expense of higher-CTR but lower-retention videos.
How is audience retention calculated?
Audience retention is the average percentage of a video watched across all views. YouTube divides the total watch time by the number of views, then by the video length. The result is reported both as a single percentage in YouTube Studio and as a graph plotted across the timeline of the video.
What's the difference between absolute and relative audience retention?
Absolute retention is the percentage of viewers still watching at each moment of your video. Relative retention compares that curve against similar videos of similar length across YouTube, and is the more meaningful benchmark because it controls for topic and format automatically.
Why does my retention graph drop sharply in the first 15 seconds?
Steep first-15-seconds drops usually indicate a hook problem: the thumbnail or title promised something the intro didn't confirm quickly enough. Common causes are long branded intros, slow verbal setups, or opening on a wide shot instead of the payoff. Rewriting the first two sentences to state the payoff typically recovers 8–15 points of retention.
Is 30% audience retention bad?
30% is below the 2026 median for most long-form niches but not automatically bad. For a 20-minute tutorial or podcast, 30% still represents six minutes of watch time per view — a strong signal. For a 5-minute entertainment clip, 30% is a clear sign the pacing or hook needs work.
How long should a YouTube video be for the best retention?
There is no universal ideal length. The best-performing length is the shortest version that fully delivers on the title's promise. In 2026, benchmarks suggest 8–12 minutes for tutorials, 3–6 minutes for entertainment, and 20–45 minutes for deep-dives and podcasts.
Can retention be too high?
Retention above 90% on videos longer than a few minutes usually indicates either extremely loyal audiences or, more commonly, low view counts skewing the average. As a video accumulates broader impressions and outside traffic, retention typically settles into its true range.
Conclusion
The most useful thing to remember about audience retention on YouTube in 2026 is that the number is a diagnostic, not a grade. A 40% retention rate is not automatically bad and a 65% is not automatically good — until you know the video's length, its niche, its traffic sources, and the shape of the curve behind the average. What matters is that you can read your own graph, spot the specific location of the largest leak, and apply one targeted intervention at a time.
The creators who consistently outperform their peers on this platform are not the ones who obsess over the headline percentage. They are the ones who look at their retention graph the way an analyst looks at an ECG, ask "what happened at this exact second?", fix that thing, and move on. Do that on your next ten uploads and you will move — not overnight, but decisively — into the top quartile of your niche.
Turn your retention graph into a to-do list
RetentionYT reads your retention curves the way an analyst would — flagging cliffs, slumps, and step drops, tagging the exact script line behind each one, and telling you which single fix will move your next video the most.
Try RetentionYT free →
Further reading (external authority references): YouTube's official Creator Academy on audience retention in YouTube Analytics; YouTube Help on how recommendations work; and the official YouTube Blog for platform announcements.
Continue reading in Retention
- How to Read Your YouTube Audience Retention Graph
- The First 15 Seconds: Writing Hooks That Actually Hold
- Fixing the Mid-Video Slump: A Field Guide
- Average View Duration vs Audience Retention: What's the Difference?
- YouTube Shorts Retention: Benchmarks & Loop Optimization
- Relative Audience Retention: The Only Benchmark That Matters
Frequently asked questions
- What is considered a good audience retention rate on YouTube in 2026?
- As a rough 2026 rule of thumb, a healthy average audience retention sits between 40% and 55% for long-form videos over 8 minutes, and between 55% and 70% for short-form and vlogs under 3 minutes. Anything above 50% on a 10-minute video is strong; above 60% is exceptional. Context matters — tutorials and podcasts tolerate lower percentages because their absolute watch time is high.
- Does audience retention affect YouTube ranking?
- Yes. YouTube's ranking model weighs relative retention and average view duration heavily because both are proxies for viewer satisfaction. Videos that hold viewers longer than similar videos on the same topic receive more impressions in Home, Suggested, and Search.
- How is audience retention calculated?
- Audience retention is the average percentage of a video watched across all views. YouTube divides the total watch time by the number of views and then by the video length. It is reported both as a single percentage and as a graph across the timeline of the video.
- What's the difference between absolute and relative audience retention?
- Absolute retention is the percentage of viewers still watching at each moment of your video. Relative retention compares that curve against similar videos of similar length across YouTube, and is the more meaningful benchmark because it controls for topic and format.
- Why does my retention graph drop sharply in the first 15 seconds?
- Steep first-15-seconds drops usually indicate a hook problem: the thumbnail or title promised something the intro didn't confirm quickly enough. Common causes are long branded intros, slow verbal setups, or opening on a wide shot instead of the payoff. Rewriting the first two sentences to state the payoff typically recovers 8–15 points of retention.
- Is 30% audience retention bad?
- 30% is below the 2026 median for most long-form niches but not automatically bad. For a 20-minute tutorial or podcast, 30% still represents six minutes of watch time per view — a strong signal. For a 5-minute entertainment clip, 30% is a clear sign the pacing or hook needs work.
- Can retention be too high?
- Retention above 90% on videos longer than a few minutes usually indicates either extremely loyal audiences or, more commonly, low view counts skewing the average. As a video accumulates broader impressions and outside traffic, retention typically settles into its true range.
Find your video’s drop-off points before you publish
RetentionYT audits your script for the moments viewers leave — so you can fix them before recording.
Get retention tips in your inbox
Occasional, practical emails on hooks, pacing, and retention. No spam.
Related posts
How to Read Your YouTube Retention Graph (and Fix What It Shows)
Your YouTube retention graph is a line-by-line map of where viewers left. Learn to read every dip, cliff, and spike — and fix each one with concrete script and edit techniques.
The Mid-Video Slump: How to Keep Viewers Watching the Middle
The hook gets the attention — the middle is where you lose it. Learn how to diagnose the mid-video slump, hold the sagging middle of your YouTube video, and lift average view duration with proven retention techniques.
5 Ways to Improve Your YouTube Audience Retention
Audience retention is the #1 signal YouTube uses to promote videos. Learn 5 proven, data-backed ways to improve YouTube audience retention — hooks, pacing, re-hooks, structure and analytics tactics.