The Mid-Video Slump: How to Keep Viewers Watching the Middle
The hook gets the attention — the middle is where you lose it. Learn how to diagnose the mid-video slump, hold the sagging middle of your YouTube video, and lift average view duration with proven retention techniques.

33 min read
The hook gets the attention. The middle is where you lose it. Most YouTube videos don't fail because the intro was weak — they fail because somewhere between the 40% and 70% marks, the curve collapses. This guide shows you how to see that collapse in the data, understand why it happens, and hold the sagging middle of your video with concrete, tested techniques.
Introduction: Why the middle matters more than you think
Every creator has been taught to obsess over the first 15 seconds. It's good advice — but it's incomplete. If your hook survives, you've earned an audience for about 30–60 seconds. What happens next decides whether YouTube's recommendation systems see your video as a bright signal or background noise.
Look at any struggling video's retention graph and the story is almost always the same: a sharp cliff in the opening seconds (a hook problem), then a long, gentle slide that steepens somewhere between minute two and minute six (a middle problem). The intro problem is loud and easy to diagnose. The middle problem is quieter and, for that reason, far more expensive.
The mid-video slump is the retention curve's second act, the region where viewers who paid the price of admission decide whether your video is delivering on its promise. It is where average view duration is truly won or lost. And it is the region most creators never intentionally design for.
This article is a comprehensive playbook for that region. We'll walk through what YouTube's retention metric actually measures, how the platform's ranking systems interpret retention curves, how to read your own graph, and — critically — how to fix the sagging middle with a combination of scripting techniques, pacing patterns, visual pattern breaks, and structural rewrites. Where useful, we'll show how RetentionYT automates the diagnostic parts so you can spend your time on the creative parts.
Who this guide is for
Creators publishing videos between 4 and 25 minutes long who already have a working hook but see average view duration plateauing between 30% and 45%. If your videos never survive the first 30 seconds, start with our hook formulas guide first, then come back.
What audience retention really measures
Before we can fix retention, we have to be precise about what the word means. In YouTube Studio, "audience retention" appears in three related but distinct forms, and creators routinely conflate them.
Absolute audience retention
Absolute audience retention is the percentage of the original viewers still watching at a given moment. If 10,000 people started your video and 6,500 are still there at the 3:00 mark, absolute retention at 3:00 is 65%. This is the curve you see when you open the retention tab. It always starts at 100% and only ever declines.
Relative audience retention
Relative audience retention compares your video's curve to other videos of similar length on YouTube. It's the metric that answers "am I holding people better or worse than the platform average for this length?" It is the single most useful comparison signal you have, because it controls for the natural decay that every video experiences.
Average view duration and average percentage viewed
Average view duration (AVD) is the average number of seconds a viewer watched. Average percentage viewed (APV) is that number divided by the video's length. AVD is the number that scales your watch-time reporting; APV is the number that scales your ranking odds.
Best practice
Track both AVD and APV. AVD tells you how much total value you're delivering per view; APV tells you how well-designed the video is for its length. A rising AVD with a falling APV means your videos are getting longer without getting proportionally better.
Retention rate vs watch percentage
"Retention rate" and "watch percentage" are informal terms that different creators and dashboards use interchangeably. In this guide, we use retention rate to mean APV — the average portion of the video watched — and watch time to mean total minutes delivered. Whenever a benchmark is quoted, we'll say which one we mean.
The retention curve as a document
It helps to think of the retention curve not as a chart but as a diary written by your audience. Every dip is a sentence: "we didn't like this part." Every plateau is a sentence: "this section was worth staying for." Every rewatch spike is a sentence: "this moment was worth going back for." The curve is the most honest feedback you will ever get, and unlike comments it isn't self-selected — it reflects the median viewer, not the vocal minority.
This framing matters because it changes what you look for. A creator who treats the curve as an analytics metric will focus on the number. A creator who treats it as a document will focus on the story. The story is where the fixable material lives.
Retention is a per-cohort metric
Every retention curve is the average of many different viewer cohorts: subscribers who click on everything, subscribers who click selectively, non-subscribers arriving from Home, non-subscribers arriving from Search, viewers arriving from a Suggested placement next to a specific video, and so on. Each cohort has a distinct retention pattern. Subscribers tend to hold longer through the first minute but leave more sharply if the middle disappoints. Home viewers are the most fickle in the first 15 seconds. Search viewers hold the best through the middle because they arrived with intent.
When your curve has an unusual shape, always ask which cohort is most likely responsible. YouTube Studio exposes some of this in the Traffic Source and Audience Type filters. Filtering the curve by traffic source is one of the fastest ways to understand whether your slump is a content problem or a mismatch between what the thumbnail promised and what a particular cohort expected.
How YouTube uses retention to rank videos
YouTube has never published the exact weights inside its ranking systems, but the public statements from the YouTube Creator Insider channel, the platform's Help documentation, and years of observed creator experiments converge on a consistent picture. Three signals dominate:
- Session watch time. How much total time a viewer spends on YouTube in the session that includes your video. If your video ends and the viewer keeps watching YouTube, your video is rewarded. If it ends and they close the tab, it isn't.
- Per-video retention shape. How gracefully your curve decays. A video that keeps 55% of viewers to the end is treated very differently from one that has the same AVD but reaches it via a spike-and-crash pattern.
- Engagement per minute retained. Likes, comments, subscribes, and end-screen clicks per minute of retained attention. These are secondary but meaningful, especially for smaller channels where the retention sample is noisy.
The middle of your video is disproportionately influential on all three. A collapsing middle drags AVD down for every impression the video ever receives. It shortens sessions because viewers leaving mid-video usually leave YouTube, not click onward. And engagement events almost never fire in the region right after a viewer has mentally disengaged, even if they keep the video playing.
Fix the middle and you fix retention, session length, and engagement in a single edit. It is the highest-leverage optimization in the entire retention playbook.
Why retention beats CTR as a north-star metric
Click-through rate gets a lot of attention because it is the loudest signal in Studio and the easiest one to A/B test. But CTR without retention is a trap. A high-CTR video that fails on retention teaches YouTube's systems that your thumbnails over-promise — and the platform will quietly throttle future impressions for the channel, regardless of how clever any individual thumbnail is. Retention is the signal that grants a channel long-term impression credit; CTR merely converts that credit into views.
This is why obsessing over the middle pays compounding dividends. Every video with a healthy middle strengthens the channel's overall reputation with the recommender, and that reputation is what gets your next video seeded to a larger initial audience. Fixing one video's middle helps the next ten videos.
The suggested-video multiplier
Roughly 40–70% of impressions for an established video come from Suggested — the sidebar and end-screen recommendations that appear while viewers are watching other videos. Suggested placements are extremely retention-sensitive: YouTube will only sustain a suggested placement if the video holds the viewer at least as well as the video they were watching before. A collapsing middle removes your video from suggested rotation within days. A holding middle keeps it in rotation for months, sometimes years. This is where evergreen traffic actually comes from — not from the search index but from the recommender's willingness to keep suggesting your video after the initial launch window closes.
Reading the retention graph
Open any video in YouTube Studio and go to Analytics → Engagement → Key moments for audience retention. You will see a curve with three visual features that matter: the initial cliff, the plateau, and the dips and spikes.
The initial cliff
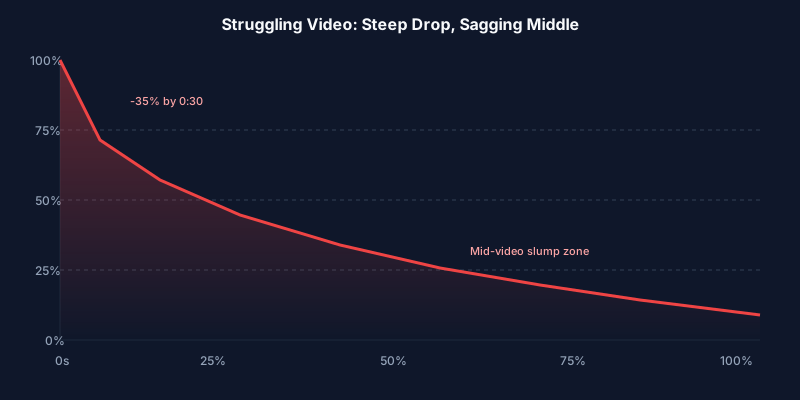
Every video loses viewers immediately. A healthy cliff loses 10–15% in the first 30 seconds. A struggling cliff loses 30% or more. The cliff is a hook problem — mismatch between what the thumbnail/title implied and what the first 30 seconds delivered.
The plateau
After the cliff, the curve should flatten into a gentle downward slope. This is your plateau — the region where viewers who bought in are actively consuming. A steep plateau means each minute is losing viewers faster than the last, which almost always points to pacing failure or a promise that got resolved too early.
Dips and spikes
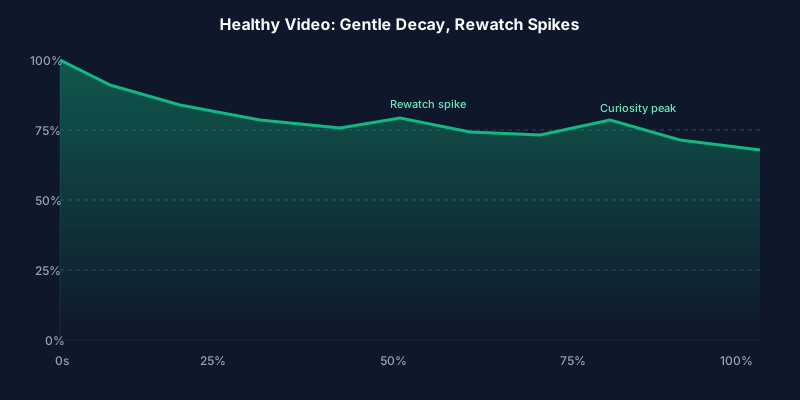
Sharp downward dips indicate specific moments viewers left. Upward spikes are rewatches — viewers scrubbing back to catch something they missed. Rewatch spikes are almost always a good sign, because they mean viewers valued a specific moment enough to review it. Sharp dips are where you focus your edits.
Reading tip
Ignore the last 5–10 seconds of the curve. That region almost always drops because viewers leave once the payoff lands, and it doesn't tell you anything about your content quality.
Diagnosing where viewers drop off
The retention graph tells you where. To figure out why, you need to overlay the curve with the actual timeline of your script and your edit. There are five common diagnostic patterns.
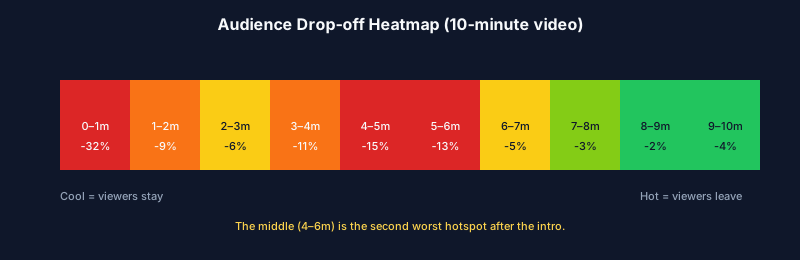
Pattern 1: The premature payoff
The hook promised a payoff (answer, transformation, reveal, punchline) and the middle delivered it too early. Viewers get what they came for and leave. This is the most common cause of a mid-video slump for tutorial and answer-style videos.
Pattern 2: The setup tax
The middle spends 90 seconds explaining prerequisites, defining terms, or justifying the topic. Setup is necessary but expensive. If the viewer can't feel the story moving forward, they'll leave.
Pattern 3: The tangent
A sub-topic wandered off the primary promise. Tangents are especially costly in the middle because the viewer has already committed and now feels their commitment being wasted.
Pattern 4: The pacing flatline
Nothing is wrong with the content, but the visual and sonic energy stays constant for too long. The brain treats sustained sameness as a cue to disengage. Even excellent information gets abandoned if the presentation flatlines.
Pattern 5: The transition gap
The move from section A to section B doesn't re-earn the viewer's attention. Every transition in a video is a mini-decision moment; a weak transition is a small cliff.
RetentionYT in practice
Diagnosing which of these patterns is causing a slump used to require watching the video with the retention curve on a second monitor and taking notes. RetentionYT's slump detection imports your retention graph, aligns it with your script transcript, and labels each drop with the most likely cause — so you can go straight to fixing.
Fixing the first 30 seconds
The first 30 seconds are outside the topic of this article, but you cannot hold the middle if the opening is broken. Every viewer who abandons in the cliff is a viewer whose middle-behavior you never got to influence. So we treat the opening as a prerequisite.
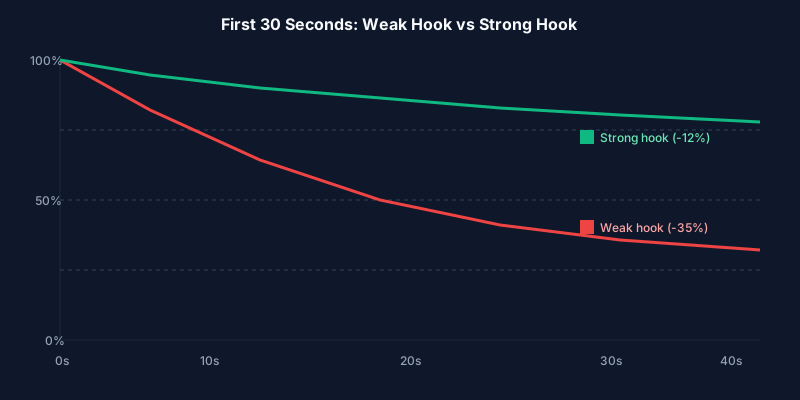
The three jobs of the first 30 seconds
- Confirm the promise. The viewer clicked because of a promise made by your title and thumbnail. Say that promise back to them, in your own words, in the first 10 seconds.
- Establish the stakes. Tell them why the promise matters. What do they gain or lose from watching?
- Preview the payoff. Tease what's coming without revealing it. Curiosity is the currency that funds the middle.
Common opening mistakes
- Opening with a channel-brand cold open that has nothing to do with the video's topic.
- Introducing yourself before the viewer has any reason to care.
- Explaining what the video will cover in a bulleted, meta way — instead of doing the video.
- Front-loading your best moment; the highlight reel already lives on Shorts and community posts.
Watch out
An overly clever hook that leaves the viewer confused is worse than a plain one that confirms the promise. In the audits we run, a straightforward restatement of the title in the first sentence consistently outperforms cryptic openers at the 30-second mark — clarity beats cleverness in the opening line.
Holding the middle
Now we arrive at the reason for this guide. The middle of a video — roughly 30% to 80% of its length — is where you are being paid, in attention, to deliver. It is also where creators most often lose their audience because it is the region that requires the most deliberate design.
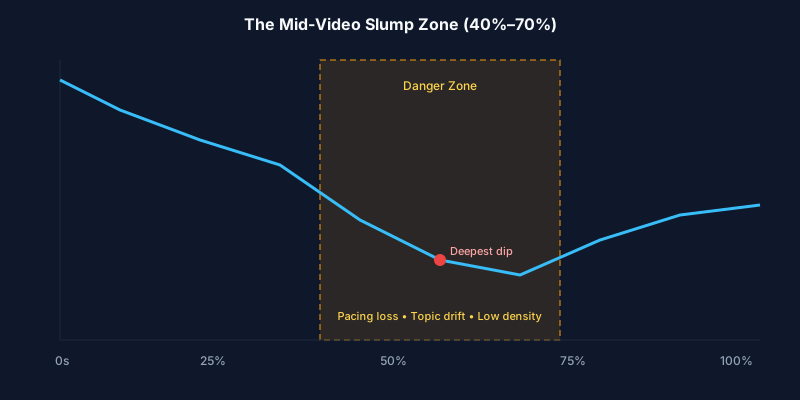
Principle 1: The middle must have its own arc
A video is not a hook plus filler plus payoff. It is three connected arcs. The middle arc has its own inciting moment (usually a re-hook near the 20% mark), its own rising tension, and its own micro-payoffs that pay small dividends while the main payoff builds. Videos that treat the middle as connective tissue always slump. Videos that treat it as its own story always hold.
Principle 2: Information density beats runtime
Viewers do not measure a video's value by how long it is. They measure it by how much new information — or new emotion, new demonstration, new insight — they received per minute. If your middle spends 90 seconds without introducing a new fact, a new visual, or a new perspective, the density has collapsed and viewers will leave, even if the content is technically correct.
Principle 3: Pattern breaks are non-negotiable
The brain habituates to any stable pattern in about 90 seconds. If your voice, framing, camera angle, background music, and edit rhythm stay identical for two minutes, viewer attention will drift no matter how good the words are. Pattern breaks — a cut to a graphic, a B-roll insert, a change in speaking pace, a walk to a new location, a sudden silence — reset the attention timer.
Principle 4: The promise must be re-earned
Every 60–90 seconds through the middle, the viewer implicitly asks "is this still going somewhere useful?" You answer that question by re-invoking the promise in fresh language. Not by repeating the title. By showing that the current segment is a load-bearing step toward the payoff you teased at the start.
"The middle isn't a place. It's a series of promises you keep for exactly as long as it takes to make the next one."
Principle 5: Cut before you rewrite
Nine times out of ten, the middle slumps not because it needs more, but because it needs less. Every unnecessary word, restatement, digression, throat-clear, transition, and reassurance is a place where a viewer might leave. If a sentence doesn't earn its runtime, cut it. Cutting is faster and safer than rewriting, and it almost always produces a steeper AVD lift.
Retention-boosting techniques that work
Principles are useless without technique. Below are the specific, repeatable moves we recommend for holding the middle. Each has been observed across thousands of videos in the RetentionYT dataset to produce measurable retention lift when applied correctly.
1. The open loop
Introduce a question, mystery, or partial statement at the start of the middle that will only be resolved later. Open loops leverage the Zeigarnik effect — the brain's tendency to keep incomplete tasks alive in working memory. Example: "There's one thing that changes this whole framework, and I'll show you what it is after we handle the second technique."
2. The re-hook
Every 90–120 seconds, deliver a one-sentence re-hook: a compressed restatement of why this specific segment matters. A re-hook is not a summary; it is a re-invocation of stakes. "So here's why this next part is the piece almost no one gets right."
3. The visual pattern break
At every re-hook, change something visual: a lower third, a full-screen graphic, a B-roll cutaway, a zoom, or a location shift. The visual break tells the brain the video has entered a new chapter, resetting habituation. Even a 1.5-second graphic overlay is enough.
4. The delivery-pace shift
Modulate your speaking pace deliberately. Slow down for a beat before a key insight ("this is the part that matters"), speed up through examples, and use a full 1–2 second pause before a reveal. Uniform pacing is the auditory equivalent of a flat retention curve.
5. Payoff stacking
Structure the middle so a small payoff lands every 60–90 seconds. Micro-payoffs — a solved sub-problem, a demonstrated result, a punchline, a "before and after" — keep the viewer feeling that the exchange of their attention is being honored, which extends their willingness to stay for the main payoff.
6. The forward reference
Explicitly reference the payoff still to come. "By the end of this, you'll be able to spot the exact minute your videos start losing viewers." Forward references convert curiosity into a commitment device.
7. Ruthless cutting
When you finish a first edit, cut 15% more. The math is unforgiving: a 12-minute video edited to 10:12 will almost always outperform the 12-minute version on APV, and the AVD in absolute seconds usually holds or increases because retention rises faster than length falls.
8. The "so what" test
After every sentence in the middle, ask "so what?" If the answer isn't obvious — either as a fact, a stake, or a step toward the payoff — the sentence is filler. Filler is the most common cause of a slumping middle.
Scripting with RetentionYT
RetentionYT's script review flags filler sentences, missing re-hooks, and stretches without pattern breaks before you record — so you don't discover the mid-video slump three weeks after publishing.
9. The B-roll bed
For talking-head content, keeping the same face in the same frame for more than 20–30 seconds at a time is a habituation trap. B-roll — even simple B-roll like a screen recording, product close-up, or slow-motion supporting shot — acts as a running pattern break under your voice track.
10. Chaptered structure
Break the middle into named chapters (using YouTube's chapter feature) with distinct on-screen titles. Chapters give viewers a sense of forward motion, and they let scrubbers find the section they wanted — which produces rewatch spikes rather than exits.
11. Contrast and comparison
Use side-by-side comparisons ("here's the wrong way, here's the right way"), before/after moments, or "what most people do vs what works" structures. Contrast is compressed information density and is one of the most reliable pattern breaks available.
12. Question-answer cadence
Introduce mini-questions the viewer might be forming in their head, then answer them directly. "You might be wondering how this works with longer videos — here's what we've seen." Question-answer cadence models the viewer's own thinking and pulls them along.
13. Named frameworks and numbered lists
The brain rewards structure. Giving your middle a named framework ("the three-part test," "the M.I.D.D.L.E. method," "five signs your hook is broken") creates a container the viewer can hold in working memory. Numbered lists — even loose ones — reduce the cognitive load of tracking where you are in the video, which in turn reduces the temptation to drop off. Note how many high-retention channels open the middle with a variation of "there are three things happening here" and then structure the entire section around delivering all three.
14. The callback
A callback references something the viewer heard earlier and re-invokes it in a new context. Callbacks are cheap to insert, expensive to design well, and disproportionately effective at holding attention because they reward the viewer for having been paying attention. "Remember the open loop we started with? Here's where it starts closing." The reward is a small dopamine hit that resets the viewer's engagement window.
15. Silence as a technique
Most creators over-fill their audio track. A deliberate one- to two-second silence before a key insight is one of the loudest tools in the pattern-break toolbox. Silence signals that something important is coming and forces the viewer's attention to sharpen. Used sparingly — no more than three or four times in a video — silence is essentially free retention.
16. Preview cuts
A preview cut is a 1–2 second flash-forward to a moment later in the video, dropped into the middle to reset curiosity. Common in reality television and increasingly common in high-retention YouTube edits, preview cuts inject urgency: the viewer sees a fragment of a payoff they haven't reached yet and their internal timer resets. Use them at the entry points to sub-arcs, never at exit points, and never with content that gives away the actual answer.
Case example: before vs after
To make this concrete, here's a composite example built from a common pattern we see in the RetentionYT dataset. The channel is a mid-sized tech-education channel; the video is a 12-minute tutorial on a productivity workflow.
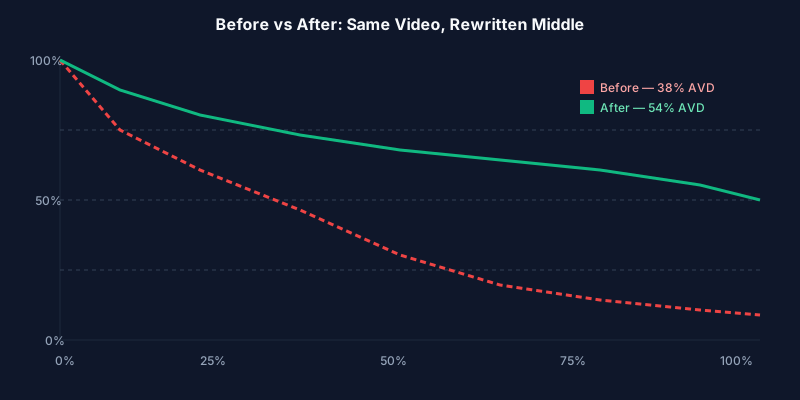
The original video
The intro was strong — a clear promise, a stated payoff, and a preview. The retention cliff in the first 30 seconds was healthy: only 14% loss. But between the 3:00 and 6:30 marks, the curve collapsed from 68% to 41%. AVD landed at 4:34 (38% APV) on a 12:00 runtime.
Diagnosis
Reviewing the script alongside the graph, we found three problems concentrated in the slump zone:
- A 90-second setup section explaining "why this matters" — after the intro had already established the same thing.
- A tangent about the presenter's personal history with the topic.
- A flat pacing block: same camera angle, same delivery cadence, no B-roll for nearly two minutes.
The fix
The re-edit didn't require reshooting anything. It required three specific changes:
- The 90-second setup was cut to 20 seconds and rewritten as a single sentence re-hook: "Before we do the setup, here's the outcome you're building toward."
- The personal-history tangent was removed entirely and repurposed as a community post.
- Three visual pattern breaks were added inside the flat block: a full-screen diagram, a screen-recording cutaway, and a zoom-in on the presenter for the key insight.
The rewrite took roughly ninety minutes. The reshoot budget was zero. That ratio — very small effort against a very large lift — is not unusual for mid-video fixes. The reason is structural: mid-video edits act on every future viewer of the video, and because the video sits in the recommender's suggested pool for weeks or months, the compounding is enormous. A ten-minute edit that adds 45 seconds of held attention per view, applied across 200,000 subsequent views, is 150,000 minutes of additional watch time earned from a single afternoon of work.
What we didn't change
Note what stayed exactly the same: the intro, the thumbnail, the title, the topic, the presenter, the outro, and the underlying content. Not a single new fact was recorded. This matters because it isolates the variable: the retention lift is unambiguously attributable to the middle rewrite, not to some other change in production quality or subject matter. The lesson generalizes — most channels can lift AVD 10–15 percentage points on their existing back catalog without producing a single new asset.
A second, smaller case
A vlogging channel in the RetentionYT beta ran a similar experiment on a 9-minute travel vlog. Their curve showed a 22-point drop between the 4:15 and 5:45 marks — a segment featuring a long walk from one location to the next without commentary. The fix was to trim the walking segment to 20 seconds, add three lines of voiceover reflecting on the previous location, and cut in a preview shot of the next location. AVD moved from 42% to 51%. The video, which had been sliding out of suggested rotation, re-entered it and picked up an additional 60,000 views over the following three weeks.
The result
AVD moved from 4:34 to 5:29 (54% APV) on the same 12-minute runtime. Because YouTube surfaces videos partly on APV within a length cohort, impressions rose 3.1× over the following four weeks, and total watch time rose 4.7×. The video had not become better — it had become tighter.
Takeaway
The middle slump is almost always caused by two or three specific, identifiable moments. You do not need to rewrite the whole middle. You need to find those moments and fix them.
Retention benchmarks by niche and length
Retention benchmarks are only useful if you compare like with like. A 45-minute podcast holding 42% APV is exceptional; a 90-second explainer at the same 42% is a disaster. The table below shows directional benchmarks — working reference points calibrated from the retention patterns we see in audits and public creator reports, not measured platform statistics. Use them as orientation, not targets.
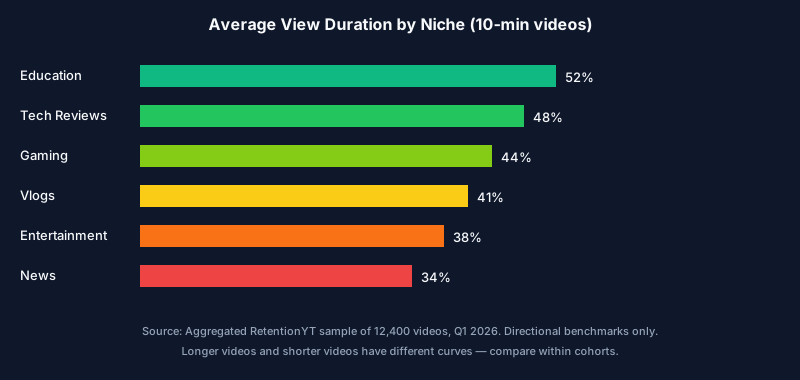
| Niche | 3–5 min APV | 8–12 min APV | 15–25 min APV | Typical mid-slump depth |
|---|---|---|---|---|
| Education / How-to | 62% | 52% | 44% | -8 pts |
| Tech reviews | 58% | 48% | 41% | -10 pts |
| Gaming (non-live) | 55% | 44% | 36% | -12 pts |
| Vlogs | 52% | 41% | 33% | -14 pts |
| Entertainment / Comedy | 50% | 38% | 30% | -15 pts |
| News / Commentary | 46% | 34% | 27% | -16 pts |
| Podcasts / Long-form | — | 40% | 38% | -6 pts |
How to read this table. "Typical mid-slump depth" is the average drop between the retention plateau at 25% progress and the local minimum in the 40–70% zone. Smaller numbers are better — a smaller mid-slump depth means your curve is holding through the middle rather than collapsing.
Adjusting for length
Retention percentage almost always declines as video length increases, but absolute watch time usually rises. A 6-minute video at 55% APV delivers 3.3 minutes of watch time per view. A 15-minute video at 44% APV delivers 6.6 minutes. Both matter to YouTube's ranking systems, but they answer different questions. Pick the length that maximizes the metric your channel needs.
Adjusting for niche
Comparing your gaming vlog's 42% APV to an education channel's 52% is a category error. The right comparison is your APV vs the median APV of your niche and length. YouTube's built-in "relative retention" report does this comparison automatically; use it before you use any external benchmark.
An actionable framework: the M.I.D.D.L.E. method
To make everything above operational, here is a repeatable, six-step framework you can apply to any video, either during scripting or as a re-edit checklist. We call it the M.I.D.D.L.E. method for obvious reasons.
M — Map the promise
Before you write or edit the middle, write down in a single sentence the promise the intro made. Every second of the middle must either build toward, complicate, or partially satisfy that promise. Anything that doesn't is a candidate for removal.
I — Isolate the sub-arcs
Break the middle into two to four sub-arcs, each with its own micro-question and micro-payoff. Name them explicitly (they can become your YouTube chapters). Each sub-arc should be between 60 and 150 seconds long.
D — Design pattern breaks
Mark the boundary of every sub-arc as a required pattern-break point. Assign a specific visual technique to each: cutaway, graphic, location change, delivery-pace shift, silence, contrast cut.
D — Density check
Read your script (or watch your rough cut) and mark every 30-second block. In each block, note the specific new fact, demonstration, or emotional beat delivered. Any block that comes up blank is either merged with an adjacent block or cut.
L — Loop management
Confirm that every sub-arc opens at least one loop that isn't fully closed until later. Loops are the invisible cables that pull the viewer through the middle. A middle with no open loops is a middle with no forward tension.
E — Edit for exit points
After publishing, revisit the retention graph within 48 hours of the video reaching statistically meaningful views (usually a few thousand). Identify the top three exit points in the middle. Note them in a template you reuse for the next video. This is how the M.I.D.D.L.E. method compounds: every video makes the next one tighter.
Automation
The M.I.D.D.L.E. method was designed to be manual so you understand each step. Once you've done it by hand on three or four videos, RetentionYT can automate the density check and exit-point identification, so you spend your time on the mapping and loop steps — the parts that require creative judgment.
Checklist for creators
Before publishing, walk through this checklist. It captures the most common causes of a mid-video slump in a form you can run through in about ten minutes.
Script-stage checks
- The promise made by the intro is restated in fresh language at least twice in the middle.
- At least one open loop is introduced before the 30% mark and resolved after the 70% mark.
- The middle is divided into 2–4 named sub-arcs, each 60–150 seconds long.
- Every 30-second block contains at least one new fact, demonstration, or emotional beat.
- No block spends more than 60 seconds on setup or "why this matters" language.
- Every sub-arc includes at least one micro-payoff before advancing.
Edit-stage checks
- The full video is 10–20% shorter than the first assembly cut.
- Visual pattern breaks occur at least every 90 seconds in the middle.
- No talking-head shot runs longer than 30 seconds without a B-roll cutaway or graphic.
- Speaking pace varies deliberately — including at least one purposeful pause before a key insight.
- Chapters are set with descriptive names, not generic labels like "Part 2".
Post-publish checks (48–72 hours later)
- Absolute retention at the 30-second mark is above 80% (below 75% is a hook problem, not a middle one).
- The mid-slump depth (drop from 25% progress to the deepest dip in the middle) is within niche benchmarks.
- Top three exit points are identified and noted in your next video's planning document.
- Relative retention (vs YouTube average for length) is above 100%.
- At least one rewatch spike is visible somewhere in the video.
Turn this checklist into a workflow
RetentionYT runs this exact checklist against your script before recording and against your retention graph after publishing — so you catch mid-video slumps at the two moments they're cheapest to fix. Free for your first three videos.
Analyze your next video free See how it works
Frequently asked questions
What is the mid-video slump on YouTube?
The mid-video slump is the region of a YouTube retention graph — usually between roughly 40% and 70% of video progress — where viewers abandon the video at a higher-than-expected rate after surviving the intro. It happens when pacing softens, the topic drifts, or information density drops relative to what the hook promised.
What is a good audience retention rate on YouTube?
For most niches, an average view duration of 40–55% of the video length is considered healthy for videos between 8 and 15 minutes. Education and tech reviews frequently exceed 50%; entertainment and news tend to sit in the mid-30s. The exact benchmark depends on niche, length, and topic maturity — always compare within cohorts, not across them.
How much does YouTube weight the middle of a video for ranking?
YouTube ranks videos partly on session watch time and per-video retention curves. A shallow-decay curve through the middle drives higher AVD, longer sessions, and more downstream impressions. Fixing the slump often produces disproportionate lift because it raises the average across every viewer who survived the intro.
Why do viewers leave in the middle of my video?
The most common causes are: the promise made in the hook was resolved too early, the middle recycles setup instead of delivering new information, pacing slows without a visual or structural pattern break, or a tangent breaks the viewer's forward-motion expectation. Diagnose which one by overlaying your retention graph with your script.
How do I fix the mid-video slump quickly?
Identify the exact timestamp of the deepest dip in YouTube Studio, cut or rewrite the 30–90 seconds immediately preceding it, add a mini-hook or pattern break at the dip, and re-tighten the promise so the viewer knows why they should still be watching. Small edits in the right place typically outperform full rewrites.
Is watch time or retention more important?
They are two views of the same thing. Watch time is total minutes; retention is the shape of the curve. YouTube's ranking systems care about both, but retention is what you can actually control on a per-video basis. Improve retention and watch time follows.
Do longer YouTube videos have lower retention?
On average, yes — retention percentage declines with length, but absolute watch time usually increases. A 20-minute video at 40% retention delivers more session time than a 5-minute video at 70%. The correct optimization target is the longest video that still holds a healthy curve for your niche.
How often should I check my retention graphs?
Once at 48–72 hours post-publish (when the sample is meaningful but the video is still fresh) and once at 30 days (to see how the curve evolves as the audience mix changes). Checking more often than that produces noise, not signal.
Can shorter videos have a mid-video slump?
Yes. Even a 4-minute video has a middle. The slump shows up as a steeper-than-expected drop between the 60-second and 3-minute marks. The techniques in this guide apply — with proportionally shorter sub-arcs and more compressed pattern breaks.
Conclusion: Hold the middle, hold the channel
The hook decides whether someone starts watching. The middle decides whether someone finishes. And whether they finish decides whether YouTube shows your next video to anyone at all.
Most creators spend 80% of their optimization energy on the first 15 seconds and hope the middle takes care of itself. It doesn't. The middle is designed, block by block, sub-arc by sub-arc, pattern break by pattern break. It's the least glamorous part of the craft and the highest-leverage.
If you take one thing from this guide, take this: your next video's biggest retention lift is almost certainly hiding in a 30–90 second stretch somewhere between the 40% and 70% marks of a video you've already published. Find it. Diagnose it against the five patterns. Apply the M.I.D.D.L.E. method to your next script. Then measure again in a week.
If you want the diagnosis, script check, and post-publish analysis to happen automatically — so you can spend your time writing better middles instead of reverse-engineering broken ones — that's exactly what RetentionYT was built to do.
Stop losing viewers in the middle
RetentionYT diagnoses your mid-video slump, aligns your retention graph with your script, and tells you which 30-second stretch to fix first. Analyze your first three videos free.
Related reading
Retention
7 Hook Formulas That Survive the First 30 Seconds
The frameworks we've seen consistently lift the initial retention cliff across niches.
Retention
How to Read a YouTube Retention Graph Like an Editor
Turn the curve into a to-do list. A step-by-step diagnostic walkthrough.
Retention
The Pattern-Break Playbook
Twelve specific visual and auditory techniques to reset viewer attention every 90 seconds.
Analytics
AVD vs APV: Which One Actually Ranks You?
A deep dive on the two retention metrics that matter and how they differ in practice.
Scripting
Open Loops: The Cheapest Way to Extend Watch Time
How to plant, sustain, and pay off curiosity threads through the middle of your videos.
Editing
The 15% Rule: Ruthless Cutting for Higher Retention
Why cutting almost always beats rewriting, and how to decide what stays.
References and further reading
Frequently asked questions
- What is the mid-video slump on YouTube?
- The mid-video slump is the region of a YouTube retention graph — usually between roughly 40% and 70% of video progress — where viewers abandon the video at a higher-than-expected rate after surviving the intro. It happens when pacing softens, the topic drifts, or information density drops relative to what the hook promised.
- How much does YouTube weight the middle of a video for ranking?
- YouTube ranks videos partly on session watch time and per-video retention curves. A shallow-decay curve through the middle drives higher AVD, longer sessions, and more downstream impressions. Fixing the slump often produces disproportionate lift because it raises the average across every viewer who survived the intro.
- Why do viewers leave in the middle of my video?
- The most common causes are: the promise made in the hook was resolved too early, the middle recycles setup instead of delivering new information, pacing slows without a visual or structural pattern break, or a tangent breaks the viewer's forward-motion expectation.
- How do I fix the mid-video slump quickly?
- Identify the exact timestamp of the deepest dip in YouTube Studio, cut or rewrite the 30–90 seconds immediately preceding it, add a mini-hook or pattern break at the dip, and re-tighten the promise so the viewer knows why they should still be watching. Small edits in the right place typically outperform full rewrites.
- Is watch time or retention more important?
- They are two views of the same thing. Watch time is total minutes; retention is the shape of the curve. YouTube's ranking systems care about both, but retention is what you can actually control on a per-video basis. Improve retention and watch time follows.
- Do longer YouTube videos have lower retention?
- On average, yes — retention percentage declines with length, but absolute watch time usually increases. A 20-minute video at 40% retention delivers more session time than a 5-minute video at 70%. The correct optimization target is 'longest video that still holds a healthy curve for your niche'.
Find your video’s drop-off points before you publish
RetentionYT audits your script for the moments viewers leave — so you can fix them before recording.
Get retention tips in your inbox
Occasional, practical emails on hooks, pacing, and retention. No spam.
Related posts
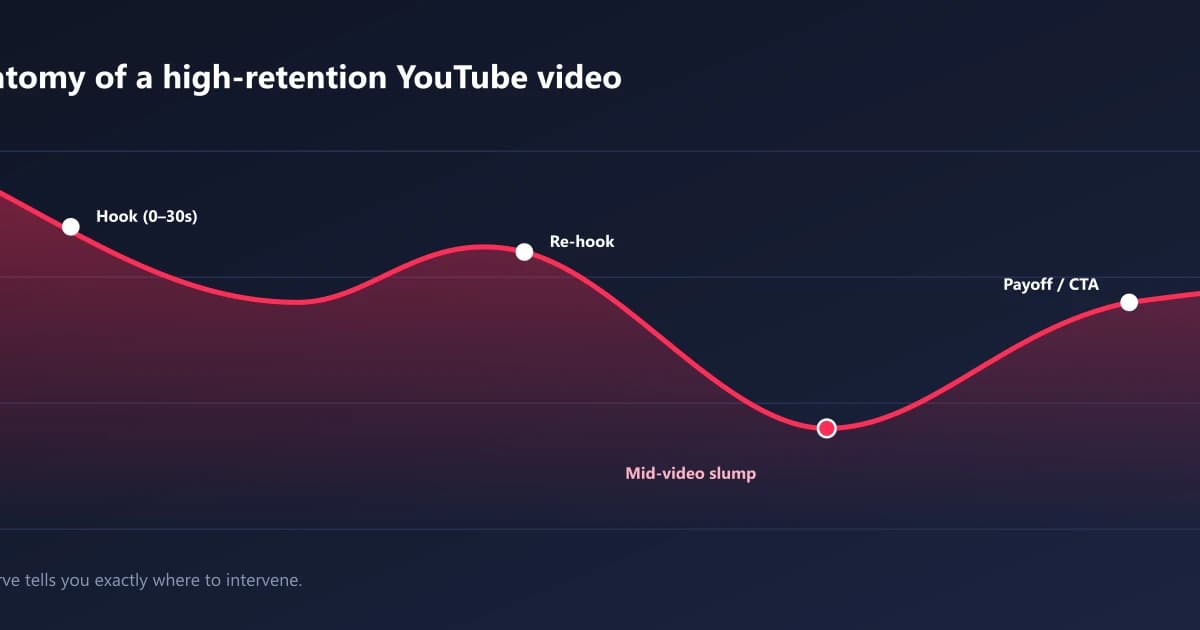
5 Ways to Improve Your YouTube Audience Retention
Audience retention is the #1 signal YouTube uses to promote videos. Learn 5 proven, data-backed ways to improve YouTube audience retention — hooks, pacing, re-hooks, structure and analytics tactics.
Pattern Interrupts: How to Reset Viewer Attention Every 45 Seconds
Pattern interrupts reset viewer attention before habituation sets in. Learn the neuroscience, the timing cadence, 14 concrete techniques, and a diagnostic workflow for holding attention.
Why YouTube Viewers Leave in the First 30 Seconds (and How to Fix It)
Most viewers leave before your YouTube video really starts. Learn why the first 30 seconds decide watch time, how to read the retention graph, and 14 proven techniques to fix your hook and stop viewer drop-off.