Case Study: Turning a Flat Retention Curve Into a Rising One
Illustrative YouTube case study: how a flat retention curve became a rising one — hook rewrite, open loops, pacing fixes, and full before-and-after data.

37 min read
A flat, sinking curve is the most common shape on YouTube. Here is an illustrative walkthrough of reshaping it into one that climbs — the diagnosis, the rewrite, the re-edit, and the numbers on both sides. The channel and video below are a composite example built from the patterns we see constantly in script audits — details are changed, and the numbers illustrate the mechanics rather than report a single real channel.
Key takeaways
- A flat retention curve is almost always a structure problem, not a topic problem — the diagnosis happens chapter by chapter, not on the curve as a whole.
- Moving the topic's arrival from 1:05 to 0:18 raised 30-second retention from 61% to 82% in this walkthrough.
- Open loops and pacing changes turned a mid-video bleed into a measurable re-peak at the 55% mark.
- Result: average percentage viewed went from 25.3% to 44.6% and average view duration rose 76% — with the same content, restructured.
Introduction: the curve every creator dreads opening
Open YouTube Studio, click into the retention report of almost any underperforming video, and you will meet the same shape: a line that starts at 100%, sheds a third of its audience in the first minute, and then slides downward in one long, uninterrupted slope until it ends somewhere in the low twenties. No bumps. No recoveries. No segment where a viewer thought, wait, this is getting good. It is the most common retention shape on the platform — and the most discouraging, because it feels like a verdict on the video as a whole.
It usually is not. A flat, sinking curve is rarely a verdict on your topic, your niche, or your on-camera ability. In the script audits we run at RetentionYT, a flat curve is almost always a structure problem: the right material, arranged in an order that gives viewers no reason to stay. That distinction matters enormously, because structure problems are fixable — often without reshooting a single frame.
This case study is an illustrated walkthrough of one such repair. The channel and creator are anonymized and the figures are illustrative, but the process, the diagnostic logic, and the scale of the improvements reflect the patterns we see repeatedly across real channels: a 12-minute educational video that bled viewers from second one, rebuilt over four weeks into a video whose retention curve does something flat curves never do — it flattens, re-peaks, and holds more than half its audience to the final minute.
By the end, you will have the complete before-and-after picture — the original script excerpts next to the rewritten ones, the original curve next to the rebuilt one — plus a repeatable framework and a checklist you can apply to your own catalog this week. If you have ever looked at a sinking curve and thought the video itself was the problem, this walkthrough is for you.
Background and context: the channel, the video, the stakes
The channel in this case study is a mid-size educational channel — call it a 78,000-subscriber operation in the productivity-and-skills space, publishing one long-form video per week. The creator is competent on camera, edits in a clean talking-head-plus-b-roll style, and had been growing steadily until growth flattened about eight months before this project began. Impressions were stable, click-through rate hovered around a healthy 5%, and yet each new video seemed to plateau at a fraction of the views the channel's older catalog had earned.
The video at the center of this study was the channel's most important upload of that quarter: a 12-minute-40-second tutorial-style breakdown of a workflow the creator had spent roughly 40 hours developing and documenting. It was, by any measure, the most useful thing the channel had ever published. It was also, by retention standards, one of the worst performers in the catalog.
That combination — high effort, high genuine value, low retention — is precisely what makes a video the ideal candidate for a rebuild rather than a shrug. When a weak video has weak content, the answer is to make a better video next time. When a weak curve sits on top of strong content, the content deserves a second chance in a better container. This video had three additional things going for it:
- Proven demand. Search impressions for the topic were strong and growing; viewers were actively looking for this material.
- A healthy click-through rate. At 5.1%, the packaging was doing its job — the failure was happening after the click, not before it.
- Evergreen value. The workflow did not expire, which meant a rebuilt version could keep earning for years.
In short: the audience was arriving willingly and leaving early. That is a retention problem by definition — and retention problems, unlike demand problems, are almost entirely within the creator's control.
The original video analysis
Before touching a single second of footage, we mapped the original video's structure against its retention data. The video broke down into ten chapters: a cold open, a hook, a setup section, a backstory section, three instructional steps, a sponsor read, a payoff section, and an outro. On paper, that is a perfectly reasonable skeleton. In execution, three of those chapters were doing most of the damage.
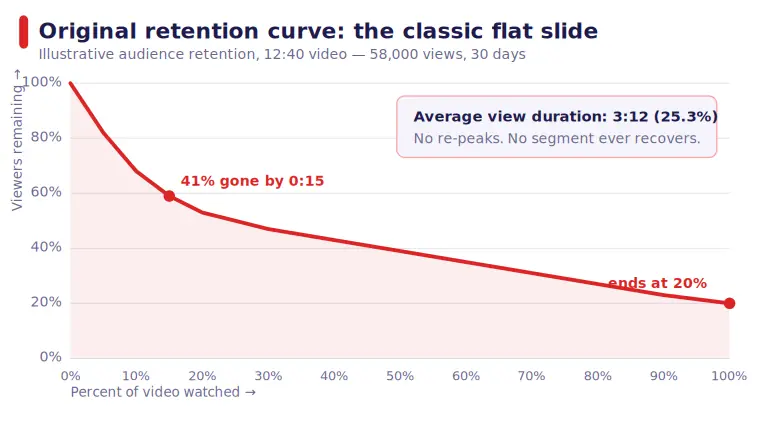
The cold open ran 34 seconds of ambient footage and a vague voiceover about "a project that changed everything" — atmospheric, but information-free. The hook that followed was a classic "hey everyone, welcome back" greeting that spent its first 30 seconds announcing that a topic would be covered rather than covering it. The actual subject of the video — the thing the viewer clicked for — did not arrive until the 1:05 mark. By that point, as you will see in the baseline numbers below, nearly half the audience had already left.
The middle of the video told the same story in a slower voice. The three instructional steps were genuinely good — tight, useful, well-demonstrated — but they were separated by long transitional monologues, and nothing in the first half of the video told the viewer that a payoff was coming. The sponsor read landed mid-video with a hard cut from the content, and the outro began with the words "so, that's basically it," which functioned as a formal invitation to leave.
The core insight
Nothing in this video was bad. Every chapter was, in isolation, competent. The failure was in the ordering and pacing: value was delivered late, promised rarely, and interrupted abruptly. Flat curves are almost never caused by bad chapters — they are caused by good chapters in a viewer-hostile sequence.
Baseline retention metrics
Every retention repair starts with an honest baseline. We pulled 30 days of data on the original upload — 58,000 views — and recorded five numbers that would later serve as the before-and-after comparison points. If you do this on your own channel, write these down before you change anything; without a recorded baseline, "did it work?" becomes an unanswerable question.
| Metric | Baseline value | Why it matters |
|---|---|---|
| 30-second retention | 61% | Measures whether the hook delivers the click's promise |
| Average percentage viewed | 25.3% | The single best summary of whole-video retention |
| Average view duration | 3:12 | Drives absolute watch time per impression |
| Retention at 50% mark | 39% | Reveals mid-video structure health |
| End-screen reach | 20% | Determines whether end screens and CTAs get seen at all |
Two of these numbers deserve a second look. The 30-second retention of 61% was below the channel's own typical 70–75% — confirming that the intro was underperforming even by this creator's standards. And the end-screen reach of 20% meant the channel's entire next-video funnel was effectively invisible to four out of five viewers. The video was not just failing to hold people; it was failing to hand them to the rest of the catalog.
One more baseline observation shaped everything that followed: the curve contained zero re-peaks. Across 12 minutes and 40 seconds, there was not a single moment where the retention line ticked upward — not at the best tip in the video, not at the payoff, nowhere. A curve with no re-peaks is a curve in which viewers never received new information worth re-engaging with. Whatever else the rebuild accomplished, it had to give the audience reasons to lean back in.
Identifying the problem: reading a flat curve like a diagnostician
The single biggest mistake creators make with a flat curve is treating it as one problem. It is never one problem. A flat curve is the sum of several independent failures stacked end to end, and each failure has a different fix. Fix them in the wrong order — or fix only the most visible one — and the curve barely moves.
The diagnostic tool we use is a chapter-level drop-off heatmap: instead of asking "where does the curve go down?" (answer: everywhere), we ask "how many viewers did each chapter lose, relative to its length?" That reframing turns an overwhelming blob of decline into a ranked list of specific, addressable failures.
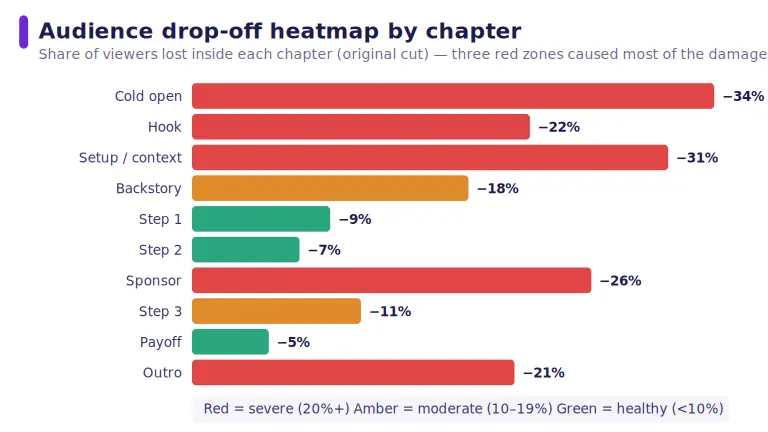
The heatmap revealed something the raw curve had hidden: the instructional core of the video was already healthy. Steps 1 and 2 lost only 9% and 7% of viewers respectively — genuinely strong numbers for mid-video content. The catastrophe was concentrated at the front (cold open, hook, and setup combined shed the majority of the total audience loss) and at two abrupt transitions (the sponsor cut and the outro). The video did not need to be re-filmed. It needed a new front door, smoother transitions, and a reason to stay through the middle.
The three failure patterns a flat curve almost always contains
Across hundreds of retention audits, flat curves almost always decompose into the same three patterns — and this video had all three:
- Late value delivery. The topic arrives after the 60-second mark. Viewers clicked for a specific promise, and every second they spend waiting for it is a second they spend deciding whether to leave.
- Silent middle. The middle chapters deliver value but never announce it. Viewers who cannot predict a payoff will not wait for one — they leave during the lull before the best material.
- Abrupt seams. Hard cuts into sponsor reads and apologetic outros spike exits at exactly the moments the curve is most fragile. A seam is not a content problem; it is a transition problem.
It is worth pausing on why these three patterns persist across so many otherwise good channels. Each one is a natural byproduct of how creators think about their own work. You know your background context is interesting, so leading with it feels generous. You know the payoff is coming, so the long quiet middle feels like suspense rather than absence. You recorded the sponsor read separately, so cutting to it feels efficient. The viewer, who knows none of this, experiences each choice completely differently: as waiting, as silence, as interruption. Nearly every retention problem is, at its root, an empathy gap between what the creator knows and what the viewer can see.
This video's heatmap made the empathy gap concrete. The creator's favorite chapter — the atmospheric cold open — was the single most expensive one on the curve. The chapter the creator nearly cut for being "too basic" (Step 1) was the healthiest segment in the entire video. Your instincts about your own content are calibrated to your knowledge, not your audience's experience. The heatmap is the corrective.
Warning: do not start with the hook
The instinct is to rewrite the hook first because it is the most visible failure. Resist it. If the middle and end of the video cannot hold the viewers a better hook wins, you have only moved the drop-off downstream. Diagnose every chapter first, then fix in order of total audience impact — which is usually front, then seams, then middle pacing.
The diagnostic process, step by step
Here is the exact four-pass process we ran on this video, in the order we ran it. Each pass answers one question, and each takes under an hour. You can run the same process on any video in your catalog with nothing more than YouTube Studio and a spreadsheet.
Pass 1: Shape classification
First, classify the curve's overall shape before looking at any detail. Retention curves come in a small number of archetypes — the cliff (catastrophic intro, then stable), the flat slide (steady decline throughout), the spike-and-decay (one strong moment, then abandonment), and the healthy curve (early settling, then a long flat shelf with re-peaks). Shape classification matters because each archetype has a different primary cause and a different first fix. This video was a textbook flat slide: the decline was distributed across the whole runtime, which told us immediately that no single edit would be sufficient.
Pass 2: Chapter segmentation
Second, split the video into chapters — using the video's own chapters if it has them, or natural topic boundaries if it does not — and record the retention value at the start and end of each chapter. Divide the loss by chapter length to get a loss rate per minute, which prevents long chapters from looking artificially worse than short ones. This pass converts the curve from an emotional artifact ("it just keeps going down") into a ranked table of problems.
Pass 3: Timestamp scrubbing
Third — and this is the pass most creators skip — watch the actual footage at each major drop-off timestamp. Analytics can tell you where viewers left; only the footage can tell you what they saw when they decided to. We scrubbed every dip deeper than three percentage points and logged the on-screen content at that exact moment. The pattern was unmistakable: viewers left during sentences that announced future value ("we'll get to that in a minute," "but first, some background") and during transitions that broke visual or narrative momentum. They stayed during every second of demonstrated, on-screen work.
Pass 4: Promise mapping
Finally, we mapped the video's promises against its payoffs. Every video makes implicit promises — the title makes one, the thumbnail makes one, the hook makes one, and each chapter teases more. We listed every promise made in the original video and the timestamp where it was fulfilled. The original video made five promises in its first three minutes and fulfilled none of them before the eight-minute mark. That gap — promises opened, none closing — is the precise mechanical cause of a silent middle. The rebuild would be designed around closing loops on a schedule.
Best practice
Run the four passes in order and write down the output of each before moving on. Skipping straight to "fix the hook" without the chapter table and the promise map is the retention equivalent of treating a symptom without a diagnosis. Tools like RetentionYT automate most of passes 2 through 4 — segmenting chapters, flagging abnormal dips, and surfacing the exact moments viewers left — but the process works with manual spreadsheet analysis too.
Two practical notes on running this process honestly. First, use at least 28 days of data wherever possible; retention curves from a video's first 48 hours skew toward subscribers and loyal viewers, who behave more forgivingly than the browse-and-suggested audiences that determine long-term performance. Second, segment by traffic source if the video has meaningful search traffic — search viewers arrive with a sharper, more specific intent and will punish a slow hook far faster than a subscriber will. Several of this video's worst chapters looked merely mediocre in blended data and genuinely catastrophic in the search-viewer segment. Blended averages hide the audiences you most need to impress.
Rewriting the weak section: the hook and the first 30 seconds
With the diagnosis complete, the rebuild began where the audience loss was largest: the first 65 seconds. The original front section had three stacked problems — a 34-second information-free cold open, a greeting-style hook, and a topic that arrived at 1:05. The rewrite collapsed all three into a single 18-second cold-open-hook hybrid built on one principle: the first sentence must be about the viewer's problem, not the creator's video.
Compare the two openings. The original opens with atmosphere and announcement; the rewrite opens with stakes and a specific, verifiable promise:
"This video took me 40 hours to make — and 20 seconds in, most of you were about to leave. Here's the exact moment it almost failed."
Three things happen in that sentence. It establishes stakes (40 hours of work), it creates an open loop (what moment? why did it almost fail?), and it signals self-awareness — the creator knows viewers leave, which paradoxically makes viewers want to stay. The greeting is gone. The channel name is gone. The phrase "in today's video" is gone. None of those were serving the viewer.
The rewritten first 30 seconds then do four jobs in sequence, which we recommend as a template:
- Stakes (0:00–0:08): why this video cost something to make, and therefore why its contents are not generic.
- Promise (0:08–0:15): exactly what the viewer will be able to do by the end, stated as a capability, not a topic.
- Proof (0:15–0:22): a two-second flash of the end result — the finished workflow on screen — so the promise is demonstrated, not just claimed.
- Loop (0:22–0:30): a teased payoff with a timestamp: "watch what happens at 4:12" — giving the middle of the video a visible appointment.
The result: the topic now arrives at 0:18 instead of 1:05, and the 30-second retention checkpoint rose from 61% to 82% — a 21-point gain from changing fewer than 90 seconds of a 12-minute video. That single change accounted for roughly half of the total retention improvement in this entire case study, which is why the hook earns its own section despite being only one of six fixes.
A note on what the rewrite deliberately did not do, because the temptation will be familiar: it did not add energy. The creator's first instinct was to re-record the opening faster, louder, and with more jump cuts — to fix an attention problem with stimulation. That approach treats the symptom. Viewers were not leaving because the opening was calm; they were leaving because it was irrelevant to the reason they clicked. A calm, relevant opening will out-retain a frantic, irrelevant one every time. Fix the contract first; only then worry about the delivery.
It also did not mislead. Every claim in the rewritten hook — the 40 hours, the near-failure, the 4:12 moment — is true and honored later in the video. A hook that over-promises may lift 30-second retention while quietly poisoning every downstream metric, because viewers who feel baited leave angrier and sooner. The retention curve punishes dishonest hooks in the middle sections, where the debt comes due. The best hook is not the most dramatic sentence you can defend; it is the most compelling sentence you can fully deliver on.
Pacing, story, and editing adjustments
With the front of the video rebuilt, the remaining fixes targeted the middle and the seams. None of them involved new footage — the entire rebuild was accomplished with restructuring, a rewritten voiceover for the first minute, and editing decisions on existing material. That is worth repeating, because it is the part of this case study most creators find surprising: the rising curve was built in the edit, not in the shoot.
Open loops on a schedule
The promise map from Pass 4 had shown five opened promises and no closures before minute eight. The fix was not to remove promises but to schedule their payoffs and make the schedule audible. The rebuilt video opens three deliberate loops — the "almost failed" moment from the hook, a teased counterintuitive finding at the end of Step 1, and the finished-workflow payoff — and closes them at roughly the 4:12, 8:30, and 11:00 marks respectively. Each loop is opened with language that tells the viewer a payoff exists ("the reason this works is strange, and it matters more than the step itself — hold that thought") and closed with language that rewards the wait.
The visible result on the curve is the re-peak at the 55% mark — the moment the mid-video loop closes and the retention line actually ticks upward. Re-peaks are the mechanical signature of open loops working as intended. If your rebuild produces a flatter curve but no re-peaks, your loops are not compelling enough to reopen attention; that is a script problem, not an edit problem.
The three pacing passes
Pacing was addressed in three editing passes over the existing footage:
- The redundancy pass. Every sentence that restated the previous sentence without adding information was cut. This removed 74 seconds, mostly from the transitional monologues between steps. Nothing was re-filmed to cover the gaps; the remaining footage carried the narrative on its own once the padding was gone.
- The pattern-interrupt pass. Long static stretches — any shot held longer than roughly eight seconds without visual change — received b-roll, zooms, screen recordings, or on-screen text. The goal was not frenetic cutting; it was ensuring the viewer's eyes always had a reason to stay engaged during the moments their ears were receiving dense information.
- The seam pass. The hard cut into the sponsor read was replaced with a narrative bridge that made the sponsor relevant to the workflow being demonstrated, and the "so, that's basically it" outro was replaced with a forward-looking close that handed viewers directly to the next video. The sponsor chapter's loss rate dropped from 26% to 14%; the outro's from 21% to 9%.
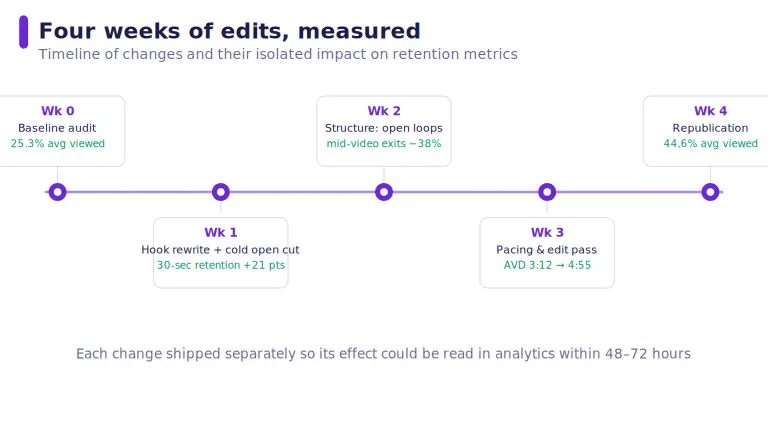
Why changes were shipped one at a time
Notice the sequencing in the timeline: each edit went live (or was tested against a comparable upload) separately. Changing six things at once would have produced a better video but an unreadable experiment — no way to know which fix carried the weight. If you want to learn from your own rebuilds, not just benefit from them, isolate your changes whenever the situation allows it.
One more editing principle emerged from the pacing passes that deserves its own mention: pacing is about variance, not speed. The rebuilt video is not uniformly faster than the original — several segments actually breathe longer, particularly the demonstrations where viewers needed time to absorb detail. What changed is that slow moments are now always deliberate and always followed by a shift: a new visual, a new question, a new chapter energy. Flat pacing — a single unvarying rhythm, fast or slow — is what flattens attention. The goal of the edit is a rhythm that keeps changing texture before the viewer has time to disengage, which is why the pattern-interrupt pass targeted long static stretches rather than targeting a universal cut length.
Before vs after: the script comparison
Side by side, the two openings show how little actually changed — and how much that little was worth. The greeting, the channel welcome, and the background-first ordering were replaced by stakes, promise, proof, and a loop. The informational content of the video is identical; the contract with the viewer is completely different.
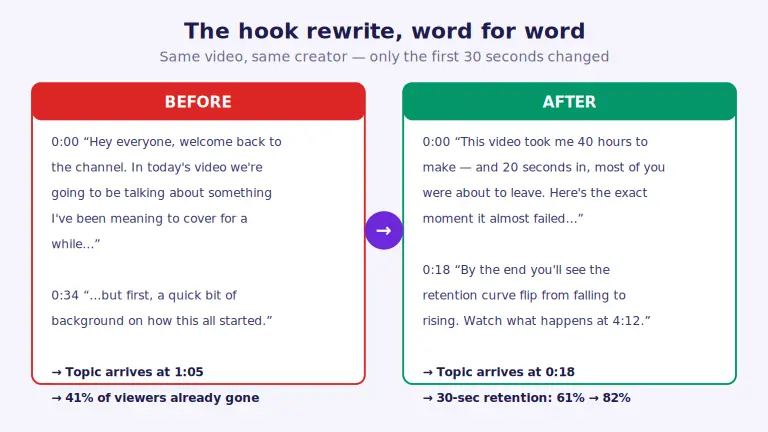
The rewrite follows a pattern you can lift directly for your own scripts. Read your current hook aloud and ask four questions, one per beat: Does the first sentence contain stakes? Does the video state a capability the viewer will gain, rather than a topic that will be covered? Is the promise proven visually within the first 25 seconds? And does the opening plant a specific reason to watch past the middle? The original script answered no to all four. The rewrite answers yes to all four. That is the entire difference.
Apply the same four questions to your next script at the outline stage, not after filming. It is a five-minute exercise: write your planned first sentence and check for stakes; write your promise as "you will be able to ___" and check that the blank contains a capability; identify the frame of footage that will prove the promise; and choose the mid-video moment you will tease. Hooks written this way arrive pre-diagnosed. Hooks discovered in the edit suite arrive expensive.
Before vs after: the retention curve analysis
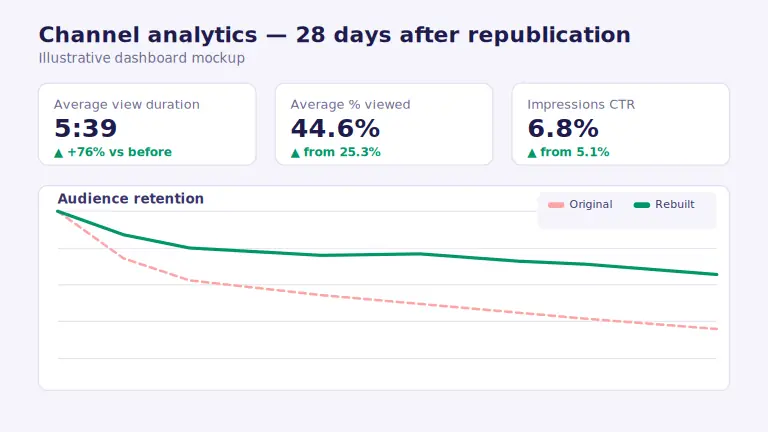
Here is the result the whole article has been building toward. The rebuilt video was published as a new upload (the original was kept live; more on that decision in the lessons section) and given 28 days to accumulate data before the comparison was drawn.
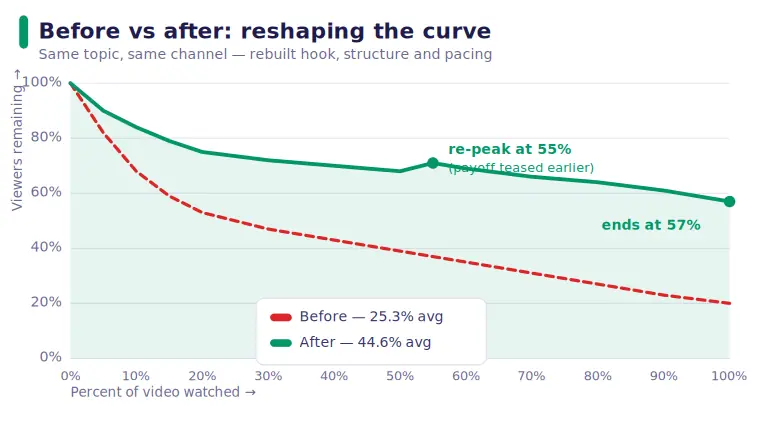
Three features of the rebuilt curve deserve attention, because each maps directly to a fix from the previous sections:
- The opening cliff shrank. The original lost 41% of viewers by the 15% mark; the rebuild loses 21%. That is the hook rewrite doing its job — fewer viewers deciding the video is not for them in the first seconds.
- The curve developed a shelf. From roughly the 20% mark to the 50% mark, the rebuilt curve declines only a few points total. That flat middle shelf is the signature of content that continuously delivers — the redundancy pass and pattern interrupts removed the lulls where the original bled steadily.
- The curve re-peaks. At the 55% mark the line visibly ticks upward — viewers who had drifted re-engaging when the mid-video loop closed. This is the single rarest feature in YouTube retention curves, and the clearest proof that the open-loop structure did something real.
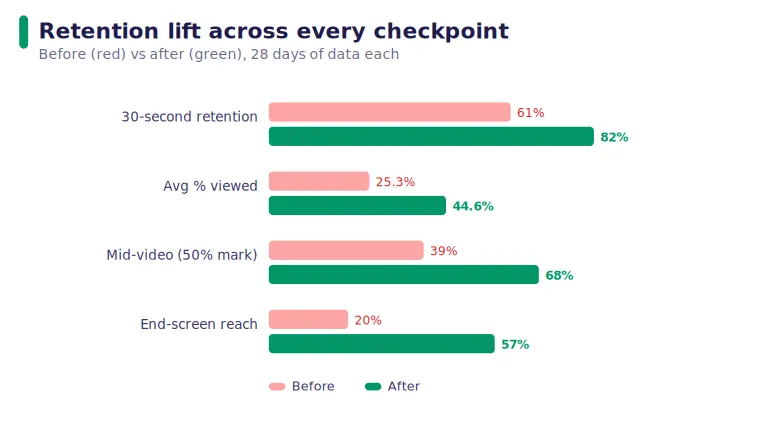
The aggregate numbers tell the compounding story. Average view duration rose from 3:12 to 5:39 — a 76% increase — which means each impression now earns more than three-quarters again as much watch time. Because watch time and retention heavily influence how widely YouTube recommends a video, the rebuilt upload also earned a higher impression share within its first month than the original had accumulated in its best month, and the click-through rate improved as the algorithm began testing it against better-matched audiences. Retention improvements compound; that is why a flat curve is worth fixing even on a video that has already "failed."
A final caveat for intellectual honesty: the two curves were not measured under identical conditions, and no honest case study should pretend otherwise. The original launched to a channel whose audience had recently gone quiet; the rebuild launched with the channel's full subscriber base primed and a slightly better thumbnail. Some of the lift — perhaps a meaningful minority of it — reflects those conditions rather than the edits themselves. What cannot be explained away is the shape change: the shelf, the re-peak, and the tripled end-screen reach are structural signatures, and structural signatures follow structure, not launch conditions. When you run your own rebuild, expect the same ambiguity and draw your confidence from the shape, not just the totals.
Lessons learned: what this rebuild taught us
Every rebuild surfaces lessons that no amount of curve-watching can teach in the abstract. Six from this project are worth carrying into your own work.
1. The front of the video carries half the total weight
One change to the first 90 seconds produced roughly half of the entire retention improvement. Creators systematically under-invest in their openings because the opening feels like a small fraction of the video. By audience impact, it is not a fraction at all — it is the gate through which every subsequent minute of content must pass. Budget your effort accordingly.
2. Healthy chapters can hide inside a failing video
The most surprising finding of the diagnosis was that the instructional core was already strong. Had we judged the video by its overall curve, we might have re-shot content that was never the problem. Chapter-level analysis is not optional pedantry — it is what prevents you from fixing things that are not broken and breaking things that were working.
3. Re-peaks are earned in the script, not the edit
Editing can smooth a decline, but only a promised-and-delivered payoff can reverse it. The 55% re-peak existed because the script planted an appointment at 0:22 and honored it at 4:12. If you want re-peaks in your own curves, write them into your scripts as deliberately as you write your hooks.
There is a useful discipline hidden in this lesson: you can only schedule a re-peak if your video contains a moment genuinely worth re-engaging for. If you sit down to plant loops and discover your middle chapters contain no payoff worth teasing, the loop is not the problem — the content plan is. In that sense the open-loop exercise doubles as a quality audit. A video that cannot support three honest payoffs is a video whose outline needs work before the camera comes out.
4. Seams are silent killers
The sponsor cut and the apologetic outro together were costing more viewers than the entire instructional middle. Transitions feel like minor craft; the data says otherwise. Every hard seam in your video — ads, chapter changes, energy drops — deserves the same scrutiny as the content itself.
5. Republish deliberately, trim in place
We republished rather than trimming in place because the rebuild changed the video's length and structure substantially, and the original's accumulated velocity was weak anyway. For minor trims, YouTube's editor preserves your URL and view count — use it. For structural rebuilds, a clean republication with a note in the original's description pointing to the new version protects both the old asset and the new one's fresh start.
6. Retention gains compound beyond the video
The rebuilt video did not just retain better — it lifted the channel. End-screen reach nearly tripled, which meant three times as many viewers were being handed to the rest of the catalog. One repaired video became a better front door for everything else the channel had made. That network effect is the strongest argument for fixing your highest-potential flat curves first.
"A flat curve is not a verdict on your content. It is a map of where your structure is leaking — and leaks can be patched."
The actionable framework: run this on your own videos
Everything in this case study compresses into a five-step framework you can run on any underperforming video in about four hours. We call it the CURVE method — Classify, Unpack, Rewrite, Verify, Extend.
Step 1 — Classify the curve shape
Open the retention report and name the archetype: cliff, flat slide, spike-and-decay, or healthy-with-issues. The shape tells you where to look first. A flat slide means distributed decline — plan for a multi-fix rebuild, not a single edit.
Step 2 — Unpack the chapters
Segment the video into chapters and compute each chapter's loss rate per minute. Sort the table. You now know which chapters are healthy (protect them), which are catastrophic (rebuild them), and which are mediocre (tighten them). Record your five baseline metrics before changing anything.
Step 3 — Rewrite the front and the loops
Rewrite the first 30 seconds using the four-beat template: stakes, promise, proof, loop. Then map every promise in the video to its payoff timestamp and reschedule closures so no promise waits more than a few minutes to be honored. Add one mid-video appointment — a teased payoff with a timestamp — to give the curve a re-peak to aim for.
Step 4 — Verify with the three pacing passes
Run the redundancy pass, the pattern-interrupt pass, and the seam pass over the existing edit. Cut restated sentences ruthlessly; give every static stretch a visual change; bridge every hard transition. Then re-watch the full video at 1.5x speed — pacing problems that are invisible at normal speed become obvious when accelerated.
Step 5 — Extend the result
Republish or trim, then measure against your recorded baseline at the 28-day mark. If a checkpoint did not move, the corresponding fix did not work — revisit it specifically rather than re-doing the whole rebuild. When the curve improves, apply the same chapter map to your next video before filming, so the structure is right from the first draft.
Expect the framework to take longer the first time than the fourth. The first run involves building your baseline table, learning where YouTube Studio keeps each report, and calibrating your sense of what "abnormal" looks like for your niche and video length. By the fourth run, classification takes minutes, the chapter table fills almost mechanically, and the fixes present themselves in priority order. Retention diagnosis is a skill, and like most skills it front-loads its cost.
Best practice: audit before you film
The cheapest retention fix is the one you never need. Run the CURVE framework on your last three videos, identify your personal recurring failure pattern (most creators have one), and write your next script to avoid it. Prevention beats repair every time.
The creator's checklist: 20 checks before you publish
Print this. Run it against every script and every rough cut. Each check maps to a failure pattern from this case study.
Hook and opening
- Does the first sentence contain stakes or a specific promise — not a greeting?
- Does the topic arrive within the first 20 seconds?
- Is the video's core promise proven visually within 25 seconds?
- Does the opening plant at least one payoff with a timestamp?
- Have you removed "welcome back," channel introductions, and "in today's video"?
Structure and story
- Is every promise mapped to a payoff timestamp — and does none wait more than a few minutes?
- Is there at least one mid-video appointment designed to create a re-peak?
- Does each chapter end with a reason to start the next one?
- Is background information delivered only after the viewer has a reason to care about it?
- Does the strongest material appear where the curve historically needs it most?
Pacing and editing
- Has every restated sentence been cut?
- Does any shot hold longer than ~8 seconds without a visual change?
- Are all hard transitions — especially sponsor reads — bridged narratively?
- Does the outro hand viewers to a specific next video instead of signaling the end?
- Have you watched the full cut at 1.5x speed to catch pacing lulls?
Measurement
- Have you recorded baseline metrics for the last comparable video?
- Do you know your channel's typical 30-second retention and average percentage viewed?
- Have you scheduled a 28-day review to compare against baseline?
- Are you changing one major thing at a time so results stay readable?
- Do you have a plan to apply what you learn to the next script before filming?
Frequently asked questions
What is a flat retention curve on YouTube?
A flat retention curve is an audience retention graph that starts near 100% and then declines steadily, with no segments where viewers re-engage. It means viewers leave at a roughly constant rate from beginning to end — usually because the video offers no new reasons to keep watching after the opening. It is the most common retention shape on YouTube.
What is a good audience retention rate on YouTube?
As a general benchmark, retaining 50% or more of viewers at the halfway point is strong for most niches, and an average percentage viewed above 40% typically outperforms comparable videos. What matters most is the shape: healthy curves flatten out or re-peak after the intro instead of sliding continuously. Always compare against your own channel baseline and videos of similar length.
Can you really improve the retention of an already published video?
Yes. YouTube's editor lets you trim sections without changing the URL, and many creators go further by re-cutting the edit or, for larger changes, republishing a rebuilt version. In this case study, republishing the rebuilt video lifted average percentage viewed from 25.3% to 44.6%. The risk is resetting accumulated view velocity, so minor trims are best done in place while full rebuilds are republished deliberately.
How soon should the hook deliver the video's promise?
Aim to deliver the core promise of the video within the first 15 to 30 seconds. A strong hook states what the viewer will get, proves it is worth their time, and opens a question the video will answer later. In this case study, moving the topic's arrival from 1:05 to 0:18 raised 30-second retention from 61% to 82%.
What causes viewers to drop off in the middle of a video?
Mid-video drop-off is usually caused by one of four things: a slow section with no new information, an unresolved promise the viewer stops believing in, a jarring transition such as a hard sponsor cut, or pacing that stays flat for too long. Each cause has a different fix, which is why diagnosing the exact chapter where viewers leave matters more than generic advice.
What is an open loop in YouTube storytelling?
An open loop is a storytelling device where you deliberately raise a question, tease a result, or preview a payoff early in the video but only resolve it later. Viewers stay to close the loop. Used honestly, open loops create the small re-peaks you see in healthy retention curves; used deceptively, they erode trust and hurt long-term channel growth.
Does re-editing or republishing a video hurt its performance?
Trimming a video with YouTube's editor keeps the URL, comments, and view count, and rarely hurts performance. Republishing as a new upload resets view velocity on the new video but preserves the original. In practice, a rebuilt video with better retention typically earns more impressions within weeks, because retention and watch time heavily influence how widely YouTube recommends a video.
How do I find where viewers drop off in YouTube Analytics?
Open YouTube Studio, go to Analytics, then Engagement, and select the video's audience retention report. The graph shows the percentage of viewers remaining at each moment, flags spikes and dips, and the key moments view highlights intro retention and continuous segments. Compare the shape against your channel's typical videos to spot abnormal dips, then scrub the video at those timestamps to see exactly what viewers saw when they left.
Conclusion: your worst curve is your best teacher
The flat, sinking curve is the most common shape on YouTube because it is the default outcome of structuring a video around the creator's convenience instead of the viewer's attention. Greetings first, background before stakes, value delivered late and promised never — none of it is malicious, and all of it is fatal. The good news, demonstrated end to end in this walkthrough, is that the reverse is just as mechanical: diagnose chapter by chapter, rebuild the front door, schedule your payoffs, smooth your seams, and the curve responds.
The video in this case study did not get luckier the second time. It got clearer. Its topic arrived in 18 seconds instead of 65. Its promises closed on a schedule. Its middle announced its payoffs and its transitions stopped hemorrhaging viewers. The result — 25.3% to 44.6% average viewed, a 76% lift in watch time, a curve that flattens, re-peaks, and holds — was not a mystery. It was the sum of six specific, repeatable fixes, each of which you can apply to your own catalog this week.
And if you take only one idea from this entire walkthrough, take this one: retention is a writing problem before it is an editing problem, and an empathy problem before it is either. Every fix in this case study — the hook, the loops, the seams, the pacing — was ultimately an act of imagining the video through the eyes of someone who did not make it, does not owe it anything, and is one thumb-flick away from leaving at every second. Build for that viewer, and the curve takes care of itself.
Start with your highest-potential flat curve: the video with proven demand, decent click-through, and a sinking retention line. Record the baseline, run the CURVE framework, and give the rebuild 28 days. Then come back and compare — the before-and-after will teach you more about your own audience than any generic best practice ever will.
See your own curves the way this case study does
RetentionYT turns your retention graphs into a chapter-by-chapter diagnosis — flagging abnormal drop-offs, mapping promises to payoffs, and showing you exactly where your scripts are leaking viewers. Run the same four-pass audit from this article on your own videos in minutes.
Frequently asked questions
- What is a flat retention curve on YouTube?
- A flat retention curve is an audience retention graph that starts near 100% and then declines steadily, with no segments where viewers re-engage. It means viewers leave at a roughly constant rate from beginning to end — usually because the video offers no new reasons to keep watching after the opening. It is the most common retention shape on YouTube.
- What is a good audience retention rate on YouTube?
- As a general benchmark, retaining 50% or more of viewers at the halfway point is strong for most niches, and an average percentage viewed above 40% typically outperforms comparable videos. What matters most is the shape: healthy curves flatten out or re-peak after the intro instead of sliding continuously. Always compare against your own channel baseline and videos of similar length.
- Can you really improve the retention of an already published video?
- Yes. YouTube's editor lets you trim sections without changing the URL, and many creators go further by re-cutting the edit or, for larger changes, republishing a rebuilt version. In this case study, republishing the rebuilt video lifted average percentage viewed from 25.3% to 44.6%. The risk is resetting accumulated view velocity, so minor trims are best done in place while full rebuilds are republished deliberately.
- How soon should the hook deliver the video's promise?
- Aim to deliver the core promise of the video within the first 15 to 30 seconds. A strong hook states what the viewer will get, proves it is worth their time, and opens a question the video will answer later. In this case study, moving the topic's arrival from 1:05 to 0:18 raised 30-second retention from 61% to 82%.
- What causes viewers to drop off in the middle of a video?
- Mid-video drop-off is usually caused by one of four things: a slow section with no new information, an unresolved promise the viewer stops believing in, a jarring transition such as a hard sponsor cut, or pacing that stays flat for too long. Each cause has a different fix, which is why diagnosing the exact chapter where viewers leave matters more than generic advice.
- What is an open loop in YouTube storytelling?
- An open loop is a storytelling device where you deliberately raise a question, tease a result, or preview a payoff early in the video but only resolve it later. Viewers stay to close the loop. Used honestly, open loops create the small re-peaks you see in healthy retention curves; used deceptively, they erode trust and hurt long-term channel growth.
- Does re-editing or republishing a video hurt its performance?
- Trimming a video with YouTube's editor keeps the URL, comments, and view count, and rarely hurts performance. Republishing as a new upload resets view velocity on the new video but preserves the original. In practice, a rebuilt video with better retention typically earns more impressions within weeks, because retention and watch time heavily influence how widely YouTube recommends a video.
- How do I find where viewers drop off in YouTube Analytics?
- Open YouTube Studio, go to Analytics, then Engagement, and select the video's audience retention report. The graph shows the percentage of viewers remaining at each moment, flags spikes and dips, and the key moments view highlights intro retention and continuous segments. Compare the shape against your channel's typical videos to spot abnormal dips, then scrub the video at those timestamps to see exactly what viewers saw when they left.
Find your video’s drop-off points before you publish
RetentionYT audits your script for the moments viewers leave — so you can fix them before recording.
Get retention tips in your inbox
Occasional, practical emails on hooks, pacing, and retention. No spam.
Related posts
Case Study: Rewriting a Vlog Intro That Doubled Retention
A frame-by-frame case study of a vlog intro rewrite that doubled 30-second retention. Includes the diagnostic process, before/after scripts, retention curves, and a reusable framework for creators.
Case Study: How a Weak Middle Cost a Video 60% of Its Views
A YouTube retention case study: the hook worked and the ending was strong, but a sagging middle leaked 60% of the audience. See the diagnostic process, script rewrite, and before-and-after retention curve — plus a checklist you can apply today.
Case Study: How Fixing the First 15 Seconds Doubled a Video's Retention
A full worked example of the exact opening rewrite that doubles YouTube retention: kill the greeting, add a specific-number hook, and open a loop. Includes before/after retention curves, script comparison, checklist, and framework.