Watch Time vs Retention: What the YouTube Algorithm Actually Rewards
Watch time vs retention sound alike but measure different things. Learn what the YouTube algorithm actually rewards and how to choose the right video length.

38 min read
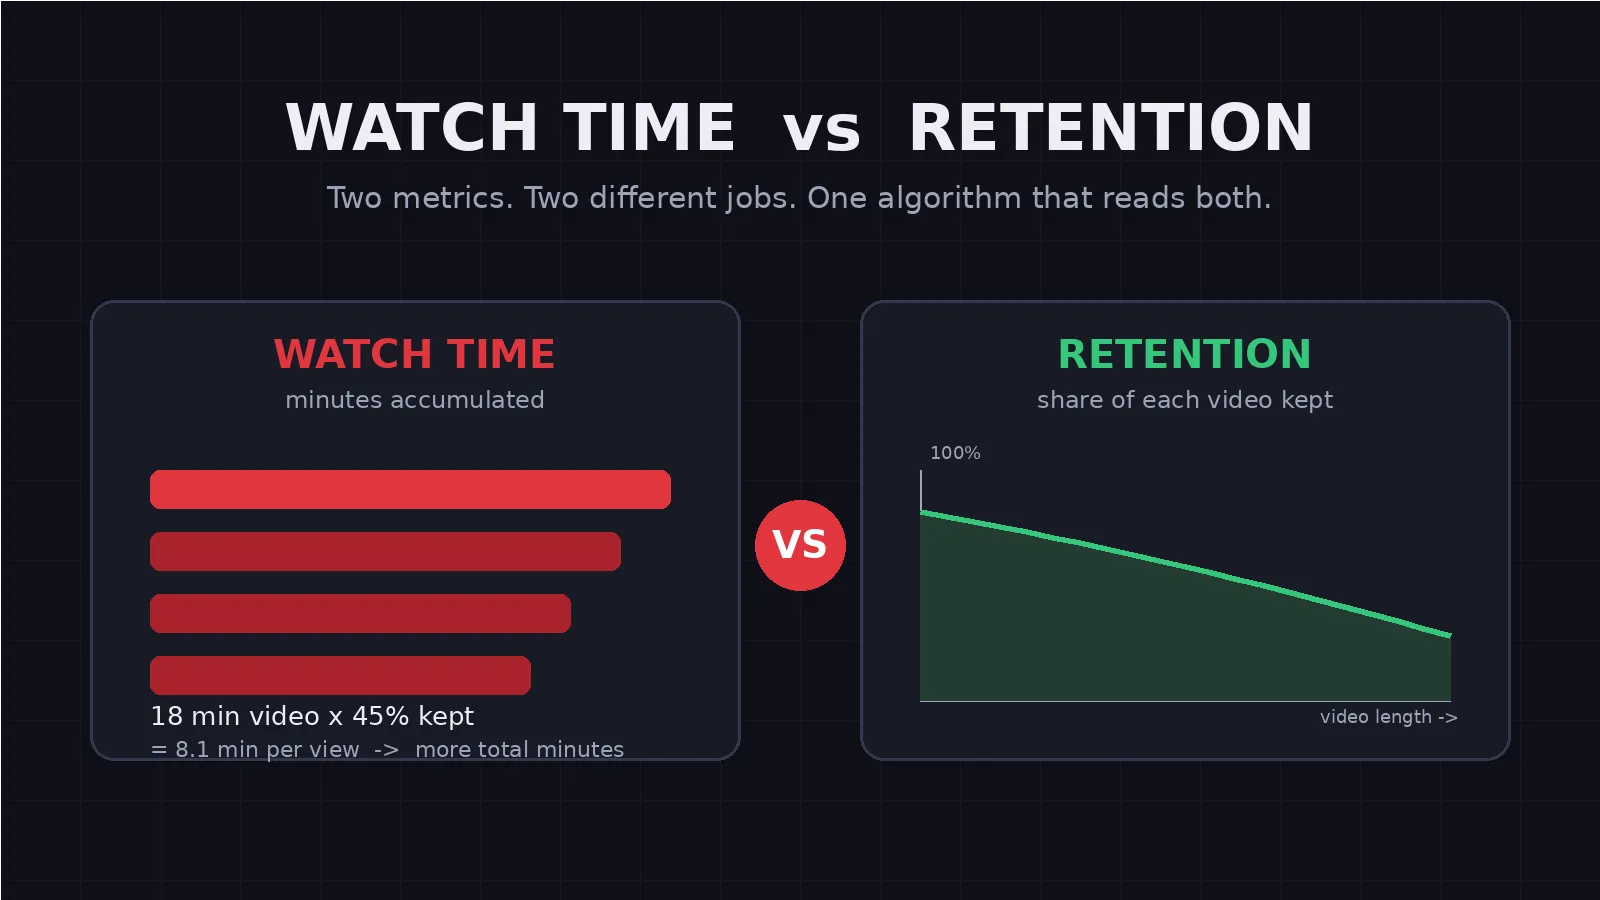
They sound like two names for the same thing. They are not — and treating them as interchangeable is how creators end up making 25-minute videos nobody finishes, or chopping strong ideas into clips too thin to rank. Here is what each metric really measures, what the recommendation engine does with them, and how to use both to make better decisions about length and content.
Introduction: the confusion that costs creators growth
Open any creator forum and you will find the same argument running in circles. One side insists that watch time is everything — the YouTube algorithm only cares about total minutes, so make longer videos. The other side swears audience retention is the real ranking factor — keep your percentage above 50% and the recommendation engine will do the rest. Both sides can point to analytics screenshots that "prove" their case, because both metrics genuinely do matter.
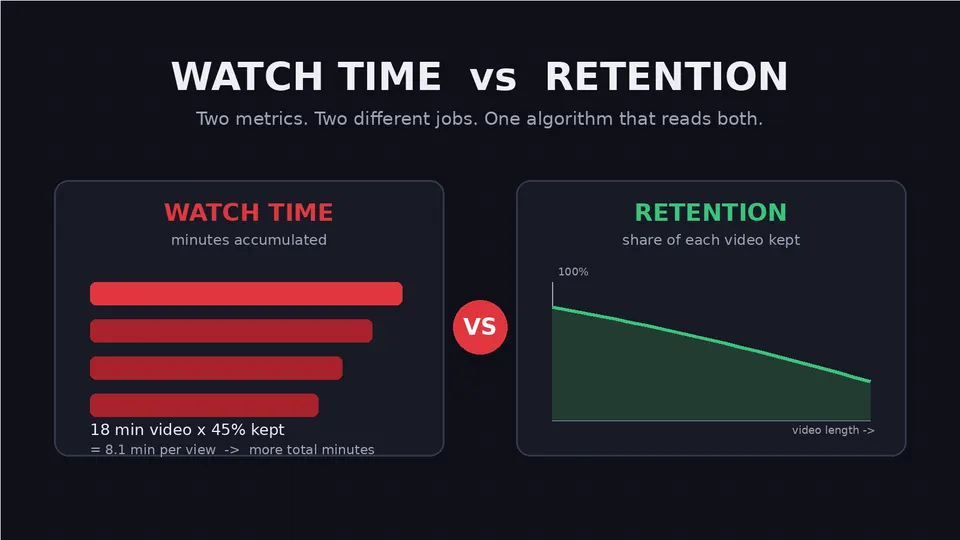
The problem is that they measure different things, answer different questions, and break down in different ways. Watch time is a quantity metric: it sums the minutes viewers spend with your content. Retention is a quality metric: it shows what share of each video individual viewers actually stuck around for. Confusing the two leads to very concrete, very expensive mistakes — padding videos to hit an arbitrary length, panicking over a retention percentage that is actually healthy for the format, or celebrating a watch-time spike that came from one long video nobody finished.
This matters more in 2026 than it did a few years ago. YouTube's recommendation system has moved steadily from crude counters toward satisfaction-weighted signals. The platform has said publicly that it layered watch time into the system in 2012 and later added satisfaction surveys to measure what it calls "valued watchtime" — minutes that viewers themselves rate as worthwhile [YouTube Official Blog]. The engine no longer asks only "how long did they watch?" It asks, increasingly, "was watching worth it?" Retention is the closest observable proxy a creator has for that second question.
In this guide we will define both metrics precisely, walk through how the YouTube algorithm actually consumes them, and then get practical: length decisions, CTA placement, Shorts versus long-form, myth-busting, worked examples with realistic numbers, and a diagnostic framework you can run on your own channel this week. The end goal throughout is simple: more views on YouTube, earned by giving the recommendation engine better evidence rather than louder packaging. Where relevant, we will show how a script-level tool like RetentionYT fits into the workflow — because the cheapest retention problem to fix is the one you catch before you record.
TL;DR: Watch time is the scoreboard; retention is the referee. The algorithm rewards videos that accumulate minutes and prove those minutes were worth keeping. Optimize retention first — watch time follows. Optimize watch time first, and you often sabotage both.
Watch time vs retention: precise definitions
Before arguing about which matters more, it helps to define both terms the way YouTube's own analytics documentation does — not the way creator folklore does.
What watch time actually measures
Watch time is the total amount of time viewers have spent watching your videos. In YouTube Analytics it appears in hours, and it aggregates across every view, every video, every session. If 1,000 people each watch 6 minutes of your new upload, that video earned roughly 100 hours of watch time. It is an accumulation metric — it grows with views, with length, and with how long each viewer stays.
Closely related is average view duration: the average minutes watched per view among the people who started your video. YouTube defines it simply as "average minutes watched among those who stayed to watch" [YouTube Help]. Duration is watch time divided by views — it normalizes the pile of minutes into something you can compare video to video.
What retention actually measures
Audience retention is a curve, not a number. It shows the percentage of viewers still watching at each moment of your video — 100% at 0:00 by definition, then declining (you hope gently) toward the end. The summary statistic derived from it, average percentage viewed, compresses that curve into one figure. YouTube's analytics API documentation describes the relative version of this metric as "how well a video retains viewers during playbacks in comparison to all YouTube videos of similar length" [YouTube Analytics API] — note the built-in length normalization, which will matter later.
Retention is per-video, per-moment, and per-viewer-cohort. Two videos with identical watch time can have wildly different retention curves, and the curve — not the total — is what tells you where a video works and where it leaks.
The one-sentence difference
Watch time asks: how many minutes did we collect? Retention asks: how much of this video did the average viewer keep? The first is about accumulation; the second is about proportion. Every strategic mistake in this space comes from answering one question while looking at the other metric.
| Dimension | Watch time | Audience retention |
|---|---|---|
| What it measures | Total minutes (or hours) watched | Share of each video viewers keep, moment by moment |
| Unit | Hours / minutes (aggregate) | Percentage curve + average percentage viewed |
| Question it answers | "How much attention did we accumulate?" | "Did this video hold the people who started it?" |
| Length sensitivity | High — longer videos can bank more minutes per view | Normalized — YouTube compares against similar-length videos |
| Grows when | Views rise, videos lengthen, sessions extend | Pacing improves, hooks land, dips are fixed |
| Easiest way to fake it | Make videos longer without making them better | Make videos shorter without saying more |
| Where to read it | YouTube Analytics → Overview / Content | YouTube Analytics → Engagement → Audience retention |
How the YouTube algorithm actually works
There is no single "YouTube algorithm." There are several recommendation surfaces — the home feed, suggested videos (Up Next), search results, the Shorts feed, and subscriptions — each with its own model and its own job. But they share a common skeleton, and understanding that skeleton clarifies exactly where watch time and retention plug in.
Candidate generation, then ranking
Modern recommendation engines, YouTube's included, work in two broad stages. First, candidate generation: from a corpus of billions of videos, the system selects a few hundred that a given viewer plausibly might watch, based on their history, subscriptions, and the behavior of similar viewers. Second, ranking: those candidates are scored and ordered, and the top few appear on the viewer's home feed or Up Next rail. Your video competes for impressions in the first stage and for the click — and then for continued promotion — in the second.
The crucial insight: ranking is personalized and predictive. The system is not asking "is this video good?" in the abstract. It is asking "how long is this specific viewer likely to watch this specific video right now — and will they feel good about it afterward?" Every signal we discuss below feeds that prediction.
The signal stack, in YouTube's own words
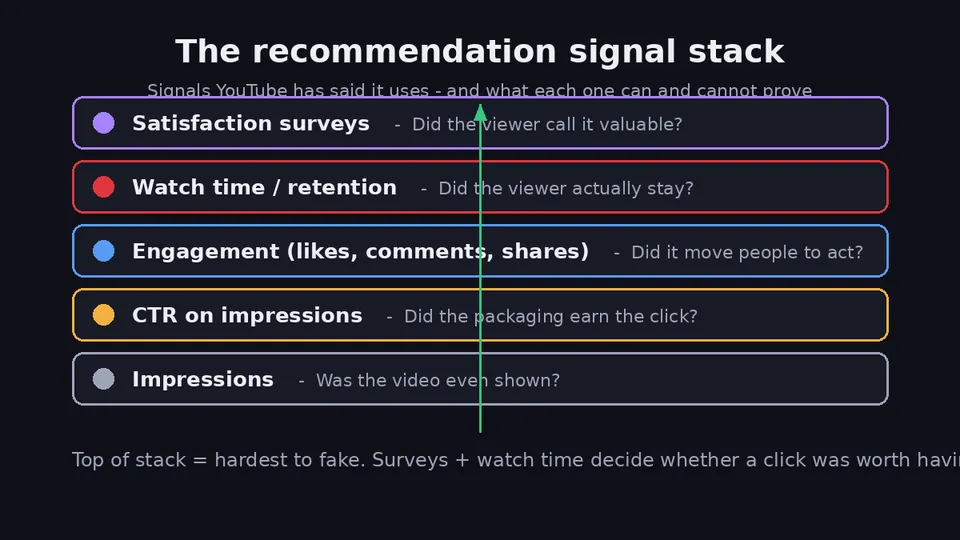
YouTube's official blog describes the inputs plainly: "A number of signals build on each other to help inform our system about what you find satisfying: clicks, watchtime, survey responses, sharing, likes, and dislikes" [YouTube Official Blog]. Notice the ordering. Clicks come first — they are the cheapest signal, the easiest to earn, and the easiest to fake. Watch time comes next. Then the satisfaction layer: surveys, sharing, likes.
The same post explains the 2012 shift that made watch time central: before that, clicks dominated, which rewarded misleading thumbnails; adding watch time meant the system could check whether the click had been honored with actual viewing. And it introduced the concept that most creators still miss — valued watchtime, measured through user surveys that ask viewers to rate what they watched from one to five stars. Only highly rated viewing counts as "valued." In other words, YouTube has spent a decade building machinery to distinguish minutes that happened from minutes that mattered.
Session time: the layer above your video
There is one more concept that reframes everything: session time. YouTube's business runs on total platform watch time, not on any single video. A video that sends a viewer into a longer platform session — because they watch your video, then your end screen routes them to another video, and another — is structurally more valuable than a video of identical length whose viewers close the app afterward. This is why "did viewers stay on YouTube" quietly influences whether your content gets re-tested with new audiences. Your video is not just being graded; it is being graded on what happens around it.
This is also why the watch time vs retention debate misses a dimension. The algorithm is not choosing between two metrics — it is running a prediction about the viewer's whole session, in which your video's minutes (watch time), its holding power (retention), and its aftermath (session continuation, satisfaction) all play roles.
Browse features vs search: two different grading rubrics
Where your traffic comes from changes what matters. In search, intent is explicit — the viewer typed a query — so relevance and demonstrated satisfaction on that query dominate. In browse features (home and suggested), there is no query; the system is gambling on predicted enjoyment, so it leans harder on click-through rate and, immediately after, on retention. A video with great search traffic and modest browse traffic is not failing — it is succeeding in a different rubric. Reading your analytics without segmenting by traffic source is the analytics equivalent of averaging apples and oranges.
The metrics that matter most
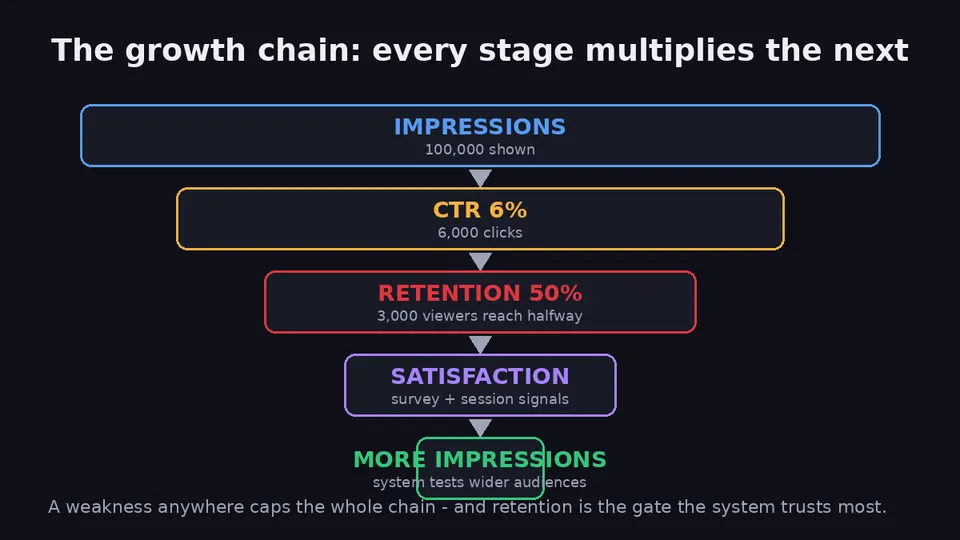
Watch time and retention sit in a chain of five linked metrics. Every stage multiplies the next, which means a weakness anywhere caps the whole chain — and a strength at the retention stage forgives a lot of weakness elsewhere.
Impressions and click-through rate: earning the click
An impression is counted when YouTube shows your thumbnail to a viewer on the platform (external embeds, end screens, and some surfaces do not count). Impressions click-through rate (CTR) measures how often viewers watched after seeing one. YouTube's own Help documentation states that "half of all channels and videos on YouTube have an impressions CTR that can range between 2% and 10%" [YouTube Help] — a wide band, because CTR depends on content type, audience size, and where the impression appeared.
CTR's job is to convert distribution into a view. But YouTube pairs it with a warning that creators should tape to their monitors: "Clickbait videos tend to have low average view duration and therefore are less likely to get recommended by YouTube" [YouTube Help]. The system explicitly cross-checks your packaging (title + thumbnail, which drive CTR) against your delivery (retention). High CTR with weak retention reads as a broken promise.
Average view duration and average percentage viewed
These two are the per-view expression of watch time and retention respectively. Average view duration (minutes) scales with video length; average percentage viewed normalizes for it. Comparing a 4-minute tutorial to a 40-minute podcast on duration is meaningless; comparing them on percentage viewed is almost meaningful. Almost — because percentage still behaves differently across formats, which is why YouTube's own analytics benchmark your retention curve against videos of similar length.
Engagement signals: likes, comments, shares
Engagement signals are the visible tip of the satisfaction layer. Comments in particular have correlated with rankings in large-scale observational studies — Backlinko's analysis of 1.3 million YouTube videos found comment count strongly correlated with higher search rankings [Backlinko]. Correlation is not causation: videos people love get watched longer and commented on more. Treat engagement as a thermometer, not a thermostat — it registers satisfaction; it does not create it.
Returning viewers and session contribution
YouTube Analytics segments your audience into new vs returning viewers, and subscribers vs non-subscribers [YouTube Help]. A healthy channel grows both: new viewers prove the recommendation engine is testing you with fresh audiences; returning viewers prove the experience was worth repeating. Watch the retention curve of returning viewers separately — if the people who already like you are leaving earlier than strangers, you have a content drift problem, not a packaging problem.
Why retention beats every other signal
With the machinery laid out, the central claim of this article becomes easy to state precisely: among the signals a creator can directly influence, retention is the one the algorithm trusts most, because it is the hardest to fake and the most diagnostic of a broken promise. Here is the argument, step by step.
Retention is the audit trail for the click
A click is a hypothesis: the viewer predicted your video would be worth their time. Retention is the experiment's result. The first 30 seconds — which YouTube's key-moments report isolates as the intro percentage — measure whether the content matched the expectation the thumbnail and title created [YouTube Help]. A video with a great CTR and a collapsing intro is not being "unfairly ignored" by the algorithm; it is being correctly diagnosed as a promise-delivery mismatch. No amount of packaging work fixes that. Only retention work does.
Retention is normalized where watch time is not
Raw watch time is structurally biased toward long videos: a 45-minute podcast banks more minutes per view than a 5-minute tutorial almost by definition. If the algorithm rewarded raw minutes alone, every creator would be incentivized to pad. The retention curve sidesteps this — YouTube explicitly compares your curve against videos of similar length, so a tight 6-minute video competes with other 6-minute videos, not with podcasts. This length normalization is what makes retention the fairer, and therefore more trusted, quality signal.
Retention predicts the signals the algorithm really wants
Satisfaction surveys, likes, shares, return visits — the high-trust signals — are all downstream of a viewer actually watching. Nobody rates a video five stars at the 8-second mark of a bad intro. Retention is therefore the leading indicator: fix the curve and the lagging satisfaction signals tend to follow. Reverse-engineering the lagging signals directly (asking for likes in the first five seconds, baiting comments) tries to inflate the thermometer reading without raising the temperature.
"Clicks tell the algorithm a viewer hoped your video was good. Retention tells it the hope was justified. Only one of those can be audited — and the algorithm knows it."
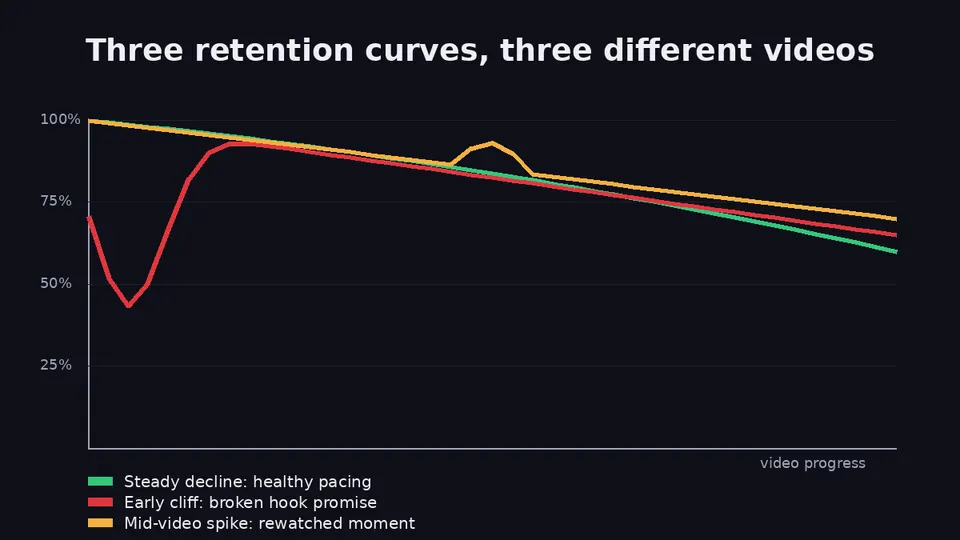
Reading the curve: the four key moments
YouTube's key-moments report highlights four retention events worth memorizing [YouTube Help]:
- Intro — the percentage still watching after 30 seconds. Low intro = packaging/content mismatch or a slow open.
- Top moments — stretches where almost nobody left. These are your proven strengths; expand them, and consider moving them earlier.
- Spikes — segments that were rewatched or shared. Usually a high-value moment, occasionally a confusing one viewers had to replay.
- Dips — segments skipped or abandoned. Your punch list: every dip is a fixable pacing, clarity, or relevance problem.
Note the practical caveat from the same documentation: retention data typically takes one to two days to process, and key moments require at least 60 seconds of video length and 100 views. Judging a curve on launch day is reading tea leaves.
The watch-time math creators get wrong
If retention is so important, where did the "just make longer videos" advice come from? From real arithmetic, read halfway. The correlation between longer videos and higher rankings is genuinely observed — Backlinko's ranking-factor study found that longer videos tended to outperform shorter ones in YouTube search [Backlinko]. But the mechanism is frequently misunderstood, and misunderstanding it produces bloated videos.
The per-view multiplication
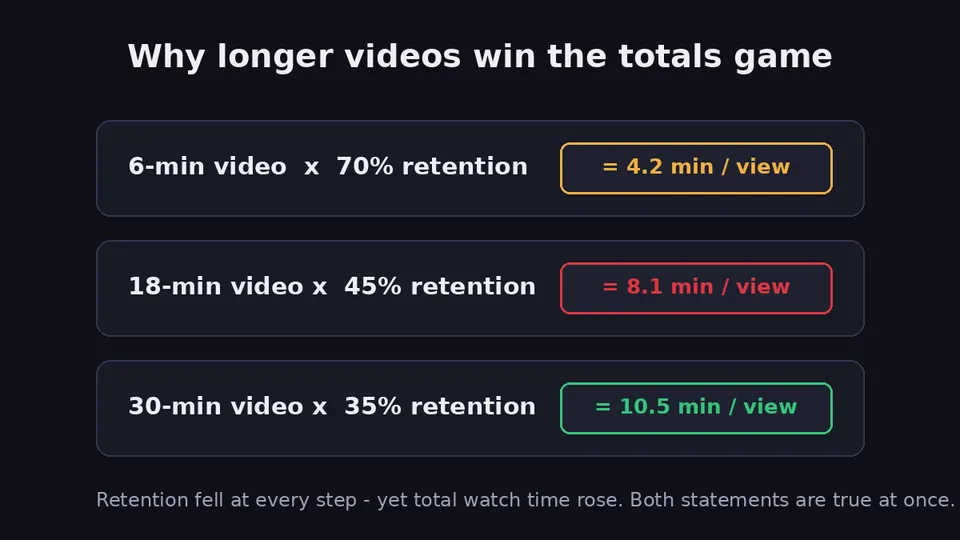
Watch time per view equals length multiplied by retention. That single equation explains both camps' evidence:
- A 6-minute video at 70% average retention yields 4.2 minutes per view.
- An 18-minute video at 45% yields 8.1 minutes per view.
- A 30-minute video at 35% yields 10.5 minutes per view.
Retention fell at every step — yet watch time per view rose. Both "watch time wins" and "retention wins" screenshots come from this table, cropped differently. The long-video camp is right that length multiplies minutes; the retention camp is right that the percentage decay is a real quality cost. The equation reconciles them.
Where the math breaks: the retention cliff
The multiplication only helps while retention decays gracefully with length. Stretch the same content from 10 minutes to 25 by padding, and retention rarely slides from 55% to 45% — it can collapse to 25%, because padding concentrates in the middle where curves are most fragile. Now the 25-minute video banks 6.25 minutes per view — barely better than a tight 10-minute video at 60% (6.0) — while carrying a much weaker quality signal into the ranking model. The longer video wins the totals game by a whisker and loses the trust game decisively.
This is why the correct framing is a retention budget: every minute you add must be paid for with retention you can afford to lose. If your content has 10 minutes of genuine value, publish 10 minutes. The marginal watch time from padding is small; the marginal signal damage is large.
Channel-level watch time is a different sport
At the channel level, watch time has a legitimate second life: it tracks library depth, binge sessions, and session time contribution. A channel whose videos chain into each other accumulates watch time per session, not just per view — and as we saw, sessions are what the platform ultimately monetizes and rewards. So the mature position is: optimize per-video retention, then multiply it across videos with playlists, end screens, and series structures. Retention wins viewers; architecture wins sessions; both together win watch time.
Practical strategies for growth
Theory is only useful if it changes what you do before hitting record. These five strategies map directly onto the retention curve — each one targets a specific, named failure mode that YouTube's own key-moments report will show you.
1. Win the first 30 seconds — match the promise, then escalate it
YouTube's intro metric measures exactly one thing: did the first 30 seconds honor the expectation set by the thumbnail and title [YouTube Help]? The two canonical failure modes are the slow open ("Hey guys, welcome back…") and the bait-and-switch (thumbnail promises X, video opens with Y). The fix is structural: open inside the subject, restate the promise in the viewer's own terms, and add one forward-looking hook — an open loop the video will close later. Cold opens, pattern interrupts, and in-medias-res structures all exist to serve this single metric.
2. Engineer the middle — open loops and pattern interrupts
Mid-video dips are rarely caused by "bad content"; they are caused by flat content — stretches where the viewer can predict the next 60 seconds and feels safe leaving. Two tools counter this. Open loops: plant a question early ("at minute six I'll show you the thumbnail mistake that cost us 40,000 views") and resolve it late. Pattern interrupts: change the visual or rhetorical register every 30–90 seconds — a cut to b-roll, a location change, a direct question, a graphic. You are not adding fluff; you are resetting the viewer's attention clock.
3. Cut ruthlessly — every segment must earn its seconds
The retention budget applies at the sentence level. Before recording, read each script segment and ask: if a viewer skipped this exact 20 seconds, what would they lose? If the answer is "nothing," delete it. If the answer is "context they need," compress it. Editing-room discipline is a retention strategy: most 12-minute videos contain a 9-minute video trying to get out.
This is precisely the stage where pre-production analysis pays for itself. RetentionYT was built for this exact pass: paste your script, and its AI audit scores hook strength, flags pacing risks and likely drop-off zones on a timeline, and suggests rewrites that keep your voice — so the dip gets fixed in the script instead of discovered in analytics two weeks after publishing. Catching a weak segment before recording costs minutes; catching it after costs the video.
4. Design for rewatch — spikes are assets
Spikes in the retention curve mean viewers rewound or shared that moment. Treat every spike as a market signal: expand the topic into its own video, clip it for Shorts, or move a version of that moment earlier in future scripts. A spike at minute 8 of a 10-minute video is the algorithm telling you the video's strongest material arrived after most of the audience had already left.
5. Architect the session — end screens, playlists, series
Per-video retention wins the view; channel architecture wins the session. End every video by routing the viewer to the single most relevant next video (not your latest — the most relevant), build playlists that binge in a deliberate order, and structure series so each episode makes the next one feel necessary. Remember the session-time layer: a viewer who watches three of your videos is worth far more to the recommendation engine than three viewers who watch one each.
Best practice: Diagnose before you optimize. Open YouTube Analytics → Engagement → Audience retention, find your worst dip across the last 10 videos, and fix that failure mode in your next script. One repaired leak beats ten new growth hacks.
Content format and length decisions
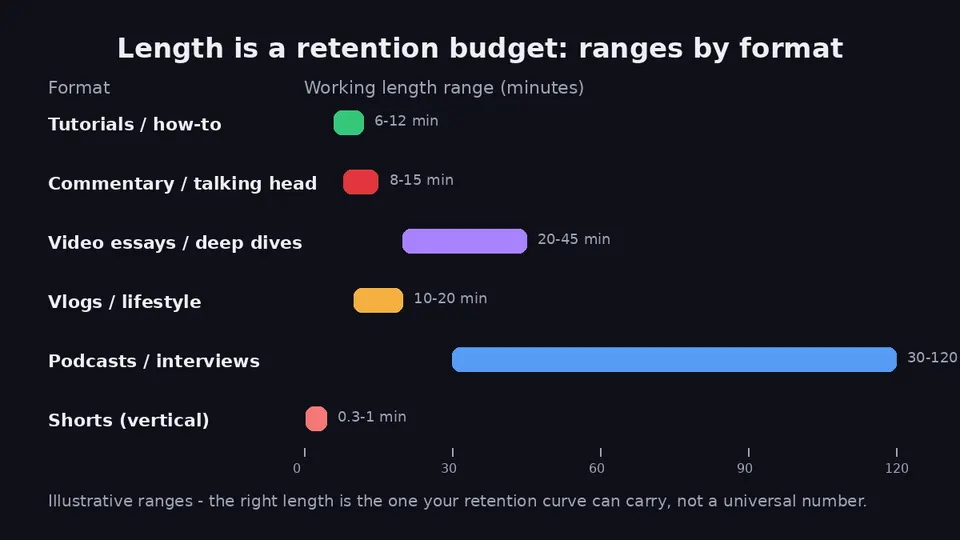
"How long should my videos be?" is the most-asked question in the watch-time-vs-retention debate, and it has no universal answer — because length is not a goal, it is a budget. The right length is the one your retention curve can carry. Still, formats have gravity: each has a working range shaped by audience expectations, and knowing yours prevents both under-cooking and padding.
Decision rules that beat benchmarks
Rather than copying a niche average, run these four tests on your own content:
- The value-density test. Outline the video, then count the genuinely valuable beats. If you have 8 beats, you have an 8–12 minute video at typical pacing. Stretching 8 beats across 25 minutes is padding by definition.
- The curve-carry test. Look at your last five videos' retention at the length you are considering. If your 15-minute videos hold 40% but your 25-minute attempts hold 22%, your current craft supports 15. Earn the longer format by fixing the mid-video leaks first.
- The format-expectation test. Viewers bring length expectations per format — a podcast audience settles in; a how-to audience wants the answer. Fighting format expectations costs intro retention before your content gets a chance.
- The marginal-minute test. For each planned minute beyond your tight cut, ask what it adds in watch time versus what it risks in retention. Per the multiplication earlier, extra minutes only pay while retention decays gracefully.
Series vs standalone: the length decision nobody models
Splitting one 30-minute idea into a three-part series changes the retention math fundamentally. Each part gets its own 100%-at-zero curve, its own intro test, its own end screen routing into the next part. If the idea's retention would have decayed to 25% by the end as a single video, three tight 10-minute parts might each hold 50%+ — tripling the quality signal while the series architecture keeps session watch time comparable. Series are not just a content choice; they are retention engineering.
CTAs and community signals
The humble YouTube CTA is where retention strategy and growth strategy collide. Every CTA spends attention — the question is whether you spend it before or after you have earned it. Misplaced CTAs create measurable retention dips; well-placed ones convert attention you already hold into subscribers, comments, and session-extending clicks.
The placement logic
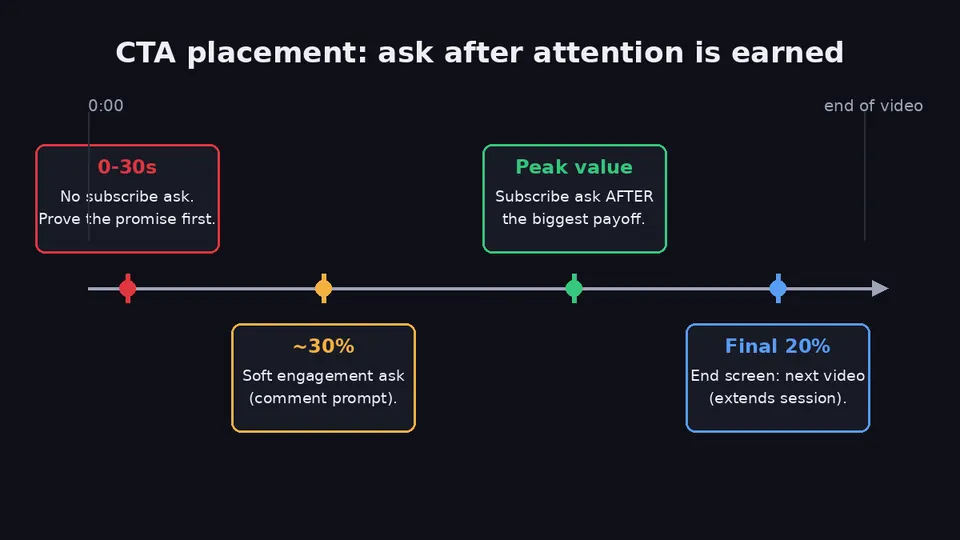
0–30 seconds: no asks. The intro percentage is being decided here, and a subscribe plea before any value is delivered spends trust you have not built. The only exception is a one-line credibility marker ("I analyze retention data for a living") that serves the promise rather than interrupting it.
Around 30%: a soft engagement ask. Once value is flowing, a lightweight prompt — "comment with the metric you check first" — costs almost nothing and seeds the comments section, which (per the Backlinko correlation) accompanies stronger rankings [Backlinko]. Keep it under five seconds and tie it to the content, not to your channel.
Immediately after the peak: the subscribe ask. The moment right after your video's biggest payoff is when goodwill peaks. That is where the subscribe CTA belongs — framed as continuation ("the next one covers X"), not obligation. Viewers subscribe to more of what they just got; ask when they just got it.
Final 20%: route, don't wrap. Do not summarize for two minutes while the curve falls off a cliff. Land the conclusion in one breath and hand the viewer a next step: an end screen to the most relevant video. This converts your ending from a retention liability into a session-time asset.
Community signals are earned, not requested
Likes, comments, and shares sit in YouTube's published signal list [YouTube Official Blog], but they behave as outputs of satisfaction rather than inputs to it. The leverage is indirect: ask better questions (specific, low-effort, opinion-based) and you get more comments; deliver a genuinely surprising moment and you get shares. Community posts, pinned comments, and replying in the first hour all extend the engagement window after upload — activity that coincides with the period when the algorithm is deciding how widely to test your video.
Warning: Engagement bait — "like if you agree," "comment YES for the algorithm" — asks viewers to act on a video they may not have finished. If the engagement arrives without the retention behind it, the signals contradict each other, and retention is the one the system trusts. Earn first, ask second.
Short-form vs long-form retention
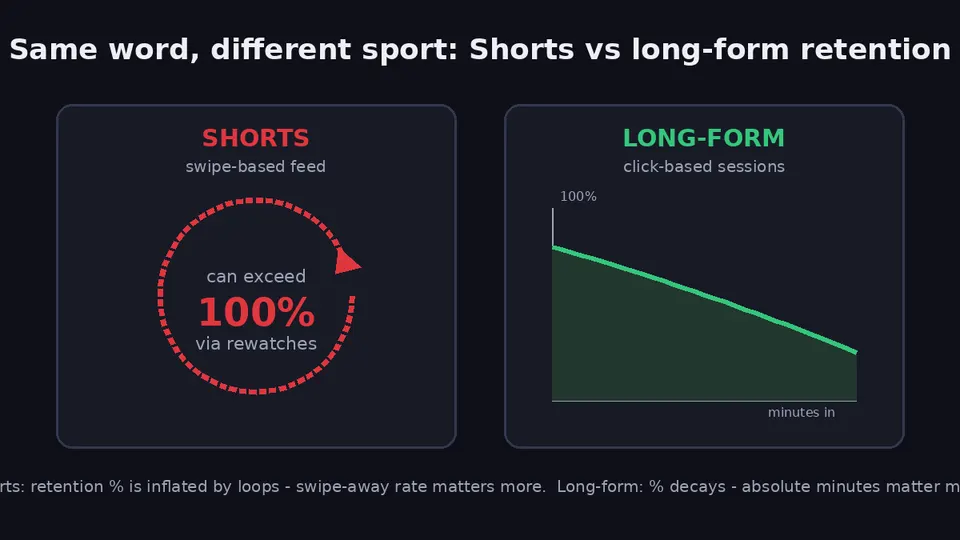
Everything said so far needs one major qualification: YouTube Shorts play a different sport with the same scoreboard. The word "retention" appears in both, but the mechanics behind the number are so different that comparing a Short's 90% to a long-form video's 45% is meaningless.
How Shorts retention actually works
Shorts live in a swipe feed: the viewer did not choose your video, they were dealt it. There is no click, no packaging test, no CTR — the first one to three seconds function as the thumbnail, judged live. Retention on a Short can exceed 100% because looping and rewatching count toward the total; YouTube's own documentation notes that average view duration for Shorts is calculated from engaged views and their corresponding watch time [YouTube Help]. The operative metrics are swipe-away rate in the opening seconds and loops per view — not the average percentage viewed that long-form creators obsess over.
What transfers — and what does not
The craft principles transfer perfectly: honor the implicit promise immediately, maintain value density, engineer a payoff worth rewatching. The strategy does not. A Short cannot accumulate meaningful watch time per view, so its role in a growth system is different: reach and discovery. Shorts introduce your channel to swipe-feed audiences; long-form converts that introduction into watch time, session depth, and subscriber growth. Channels that treat Shorts as the destination optimize a metric (loops) that barely feeds the scoreboard (watch time hours); channels that treat Shorts as the top of a funnel get both.
Common growth myths debunked
Myth 1: "Longer videos always rank better"
The observed correlation between length and rankings [Backlinko] is real but confounded: longer videos accumulate more minutes per view when they hold viewers, and topics that support long videos (documentaries, deep dives) tend to be made by creators with stronger craft. The mechanism is length × retention, not length alone. Padding a 10-minute idea to 25 minutes typically collapses retention and nets you little extra watch time plus a weaker quality signal.
Myth 2: "You need 50%+ retention or the algorithm buries you"
There is no universal retention threshold, and YouTube never published one. Retention is compared against videos of similar length — a 45-minute podcast holding 35% can outperform its cohort while a 3-minute clip at 45% underperforms its own. Benchmark against your niche, your length, and your own history, not against a number from a guru's thumbnail.
Myth 3: "CTR is the real ranking factor"
CTR decides whether a shown impression becomes a view — nothing more. YouTube explicitly warns that high CTR with low average view duration is the clickbait signature and is less likely to be recommended [YouTube Help]. CTR without retention is a promise without delivery.
Myth 4: "The algorithm punishes small channels"
Small channels see lower impressions because the system has less data about whom their videos satisfy — a cold-start problem, not a punishment. The published signals (clicks, watch time, surveys, engagement) contain no "subscriber count" input [YouTube Official Blog]. Videos from tiny channels routinely break out when their early retention cohort performs; the engine tests, measures, and widens distribution for videos that hold their first audiences.
Myth 5: "Upload time and hashtags move the needle"
These sit at the margin of discoverability at best. They do not appear in the satisfaction signal stack, and no amount of scheduling cleverness compensates for a curve that collapses at 0:45. Spend the optimization energy on the intro instead.
Data-driven examples
The following composite scenarios use realistic numbers to show how the watch-time-vs-retention lens changes real decisions. The figures are illustrative models, not guarantees — but the arithmetic is the same arithmetic running inside your own analytics.
Example A: The padded tutorial
A tech channel stretches a 9-minute Excel tutorial to 22 minutes with long intros, sponsor reads mid-video, and repeated recaps. Watch time per view rises from 6.3 to 8.8 minutes — looks like a win. But average percentage viewed falls from 70% to 40%, the intro percentage drops to 52% (the padded open lost impatient searchers), and impressions plateau within a week: the system's tests with new audiences keep failing the delivery check. The "winning" watch-time number masked a losing quality signal.
Example B: The tight cut that tripled impressions
The same channel's next tutorial covers the same topic in 11 minutes: cold open inside the spreadsheet, one open loop ("the formula at the end replaces your whole workflow"), zero recaps. Average percentage viewed: 63%. Watch time per view: 6.9 minutes — lower than the padded version. Yet impressions triple over three weeks, because every test audience held long enough for satisfaction signals to accumulate. Watch time per view fell; watch time per thousand impressions — the number the ranking model actually sees — more than doubled.
Example C: The Shorts funnel
A commentary channel posts a 40-second Short that loops well (retention equivalent: 118%, meaningless in isolation) and pulls 200,000 swipe-feed views. Alone, it banks perhaps 2,700 hours of watch time — trivial. But 1.8% of those viewers tap through to the pinned long-form video, a 14-minute piece holding 48%: that routing adds roughly 24,000 hours of session-weighted watch time and 900 subscribers. The Short's job was never minutes; it was discovery for the video that earns minutes.
| Scenario | Watch time / view | Avg % viewed | Algorithm outcome |
|---|---|---|---|
| A — padded 22-min tutorial | 8.8 min | 40% | Impressions plateau; new-audience tests fail |
| B — tight 11-min tutorial | 6.9 min | 63% | Impressions triple over 3 weeks |
| C — Short routing to long-form | — (discovery) | 118% (looped) | 24,000 hrs added via routed long-form session |
The pattern across all three: the algorithm's unit of account is not watch time per view — it is satisfied watch time per impression. Retention is what converts an impression into satisfied minutes; length merely scales whatever the retention curve has earned.
The actionable framework: the Retention-First Loop
Everything in this article compresses into a five-step operating loop you can run every week. It is deliberately boring — the channels that grow are the ones that run boring diagnostics consistently.
- Step 1 — Segment your analytics by traffic source Split the last 28 days into browse, search, suggested, and Shorts feed. Each surface grades differently: browse punishes weak intros, search punishes weak relevance. Never average them together.
- Step 2 — Pull the retention curves of your last 10 videos Wait until each video is at least 48 hours old (retention data takes one to two days to process [YouTube Help]). For each, record: intro percentage, the timestamp of the worst dip, and average percentage viewed.
- Step 3 — Classify each failure into one of four buckets Every weak curve fits a bucket: hook failure (intro < 60%), pacing failure (mid-video dip), promise failure (good CTR, early cliff — the packaging oversold), or length failure (graceful curve that simply runs out of value before the video runs out of minutes). One video can carry several; fix the earliest one first, because later fixes are invisible to viewers who already left.
- Step 4 — Fix the next script at the failing timestamp Take the single highest-impact failure and repair it structurally in your next script: rewrite the hook, compress the sagging section, or right-size the length. This is the step where pre-record auditing pays off — a script-level tool like RetentionYT flags weak hooks, pacing risks, and drop-off zones before you film, so the fix costs a rewrite instead of a video.
- Step 5 — Re-measure after two uploads, not two days Retention improvements show up in impressions within weeks, not hours. Compare like with like: same format, similar length, same primary traffic source. If the repaired failure mode disappears from the next two curves, the fix worked — move to the next bucket.
The one-line version: find the earliest moment viewers leave, fix that moment in the next script, and let watch time compound on top of a curve that finally holds.
Checklist for creators
Print this. Run every upload through it.
Before recording
- The first 30 seconds restate the thumbnail's promise and add one open loop.
- Every script segment passes the value test: a viewer skipping it would lose something real.
- Length matches the number of genuine beats — no padding to hit a target duration.
- CTAs are placed: none in 0–30s, soft engagement ask ~30%, subscribe after the peak, end screen at the close.
- The script has been audited for pacing risks (manually or with a tool like RetentionYT).
At publish
- Title and thumbnail make one specific promise the video provably keeps.
- The end screen routes to the most relevant next video, not merely the newest.
- The video sits in a binge-ordered playlist.
- You reply to early comments within the first hour.
48+ hours later
- Check intro percentage: below ~60% means the hook or the packaging missed.
- Mark the worst dip and classify it: hook, pacing, promise, or length failure.
- Compare average percentage viewed against your own similar-length videos, not a universal benchmark.
- Check CTR only after substantial impressions — and never alongside a collapsing duration curve without acting on the curve first.
- Write the single fix into the next script. One repaired leak per upload.
Frequently asked questions
Is watch time or retention more important for the YouTube algorithm?
They do different jobs, so the honest answer is both. Watch time is the currency YouTube accumulates — total minutes viewers spend with your content. Retention is the quality signal that tells the recommendation engine whether those minutes were earned. A video can pile up watch time simply by being long, but low retention on that same video tells the system people are leaving early. In practice, retention decides whether your watch time is trusted, so treat retention as the lever and watch time as the scoreboard.
What is a good audience retention rate on YouTube?
There is no single benchmark, because retention depends on video length, niche, and traffic source. As a rough working guide for long-form videos, keeping around 50% or more of viewers to the midpoint is strong, and an average percentage viewed above 40% on an 8–15 minute video is healthy. YouTube compares your retention curve against videos of similar length inside YouTube Analytics, which is a better reference than any universal number.
Does a longer video always get more watch time?
A longer video can generate more watch time per view, but only if its retention curve can carry the extra minutes. A 20-minute video watched to 40% yields 8 minutes per view; an 8-minute video watched to 70% yields 5.6. But if stretching the same content to 20 minutes drops retention to 20%, you get only 4 minutes per view plus a weak quality signal. Length multiplies watch time only when the content earns the extra minutes.
What is the difference between average view duration and audience retention?
Average view duration is a single number: the average minutes watched per view across everyone who started the video. Audience retention is the full curve: the percentage of viewers still watching at each moment of the video. Duration tells you how much; the retention curve tells you where. Creators fix videos with the curve — intro percentage, dips, spikes — not with the single average.
Can YouTube Shorts retention go above 100%?
Yes. Shorts are measured in a looping, swipe-based feed, and rewatches count toward the percentage, so a Short that viewers loop can show retention above 100%. That makes the percentage hard to compare with long-form retention. For Shorts, the more meaningful signals are how often viewers swipe away in the first seconds and how often they choose to keep watching or rewatch.
What click-through rate does YouTube consider normal?
According to YouTube's own Help documentation, half of all channels and videos on the platform have an impressions click-through rate between 2% and 10% [YouTube Help]. YouTube also warns that a high CTR paired with low average view duration is the signature of clickbait, which the recommendation system is less likely to promote. CTR earns the click; retention decides what happens next.
How long does it take for retention data to appear in YouTube Analytics?
YouTube states that audience retention data typically takes one to two days to process. The key moments for audience retention report also requires a video to be at least 60 seconds long and have at least 100 views before moments like intro percentage, spikes, and dips are highlighted. Avoid judging a video's curve on launch day.
Should I ask viewers to subscribe at the start of the video?
Usually no. The first 30 seconds are where retention is won or lost, and an ask before any value is delivered spends attention you have not earned yet. A better pattern: prove the thumbnail's promise in the intro, place a soft engagement prompt around a natural pause, ask for the subscription immediately after the video's biggest payoff, and use the final 20% for an end screen that routes viewers into another one of your videos.
Conclusion: retention is the lever, watch time is the scoreboard
The watch-time-vs-retention debate dissolves once you see the two metrics for what they are: factors in the same product, graded by a system that has spent a decade learning to tell earned minutes from accidental ones. Watch time measures accumulation; retention measures proof. The algorithm needs both — but it trusts retention, because retention is the audit trail for the click, the length-normalized quality signal, and the leading indicator of every satisfaction metric YouTube surveys for.
The practical translation is a single habit: stop asking "how long should my videos be?" and start asking "where does my curve leak?" Find the earliest dip, classify it — hook, pacing, promise, or length — and fix that moment in your next script. Right-size your length to the value you actually have. Place your CTAs after the attention they spend. Use Shorts for discovery and long-form for depth. Then let watch time do what it does best: multiply whatever your retention has earned.
If you want to catch those leaks before they cost you a video, RetentionYT runs your script through an AI retention audit — hook scoring, drop-off predictions on a timeline, and rewrites that keep your voice — so you record knowing where the curve would have broken. Start free; your first three audits are on us.
Keep reading: related RetentionYT guides
- How to Read Your Audience Retention Curve (and Fix Every Dip) — a field guide to intros, top moments, spikes, and dips.
- The First 30 Seconds: Hook Formulas That Survive the Intro Test — script structures for the metric that decides your reach.
- Click-Through Rate vs Average View Duration: the Packaging-Delivery Balance — the companion piece to this article.
- How Long Should a YouTube Video Be? A Retention-Budget Approach — the length decision framework in depth.
- End Screens, Playlists, and Session Time: Architecture That Compounds Watch Time — turn single views into sessions.
Note: update these hrefs to the final slugs once the companion articles ship — they are the recommended internal-link targets for this page within the YouTube Growth category.
Frequently asked questions
- Is watch time or retention more important for the YouTube algorithm?
- They do different jobs, so the honest answer is both. Watch time is the currency YouTube accumulates — total minutes viewers spend with your content. Retention is the quality signal that tells the recommendation engine whether those minutes were earned. A video can pile up watch time simply by being long, but low retention on that same video tells the system people are leaving early. In practice, retention decides whether your watch time is trusted, so treat retention as the lever and watch time as the scoreboard.
- What is a good audience retention rate on YouTube?
- There is no single benchmark, because retention depends on video length, niche, and traffic source. As a rough working guide for long-form videos, keeping around 50% or more of viewers to the midpoint is strong, and an average percentage viewed above 40% on an 8–15 minute video is healthy. YouTube compares your retention curve against videos of similar length inside YouTube Analytics, which is a better reference than any universal number.
- Does a longer video always get more watch time?
- A longer video can generate more watch time per view, but only if its retention curve can carry the extra minutes. A 20-minute video watched to 40% yields 8 minutes per view; an 8-minute video watched to 70% yields 5.6. But if stretching the same content to 20 minutes drops retention to 20%, you get only 4 minutes per view plus a weak quality signal. Length multiplies watch time only when the content earns the extra minutes.
- What is the difference between average view duration and audience retention?
- Average view duration is a single number: the average minutes watched per view across everyone who started the video. Audience retention is the full curve: the percentage of viewers still watching at each moment of the video. Duration tells you how much; the retention curve tells you where. Creators fix videos with the curve — intro percentage, dips, spikes — not with the single average.
- Can YouTube Shorts retention go above 100%?
- Yes. Shorts are measured in a looping, swipe-based feed, and rewatches count toward the percentage, so a Short that viewers loop can show retention above 100%. That makes the percentage hard to compare with long-form retention. For Shorts, the more meaningful signals are how often viewers swipe away in the first seconds and how often they choose to keep watching or rewatch.
- What click-through rate does YouTube consider normal?
- According to YouTube's own Help documentation, half of all channels and videos on the platform have an impressions click-through rate between 2% and 10% [[YouTube Help]](https://support.google.com/youtube/answer/7628154). YouTube also warns that a high CTR paired with low average view duration is the signature of clickbait, which the recommendation system is less likely to promote. CTR earns the click; retention decides what happens next.
- How long does it take for retention data to appear in YouTube Analytics?
- YouTube states that audience retention data typically takes one to two days to process. The key moments for audience retention report also requires a video to be at least 60 seconds long and have at least 100 views before moments like intro percentage, spikes, and dips are highlighted. Avoid judging a video's curve on launch day.
- Should I ask viewers to subscribe at the start of the video?
- Usually no. The first 30 seconds are where retention is won or lost, and an ask before any value is delivered spends attention you have not earned yet. A better pattern: prove the thumbnail's promise in the intro, place a soft engagement prompt around a natural pause, ask for the subscription immediately after the video's biggest payoff, and use the final 20% for an end screen that routes viewers into another one of your videos.
Find your video’s drop-off points before you publish
RetentionYT audits your script for the moments viewers leave — so you can fix them before recording.
Get retention tips in your inbox
Occasional, practical emails on hooks, pacing, and retention. No spam.
Related posts
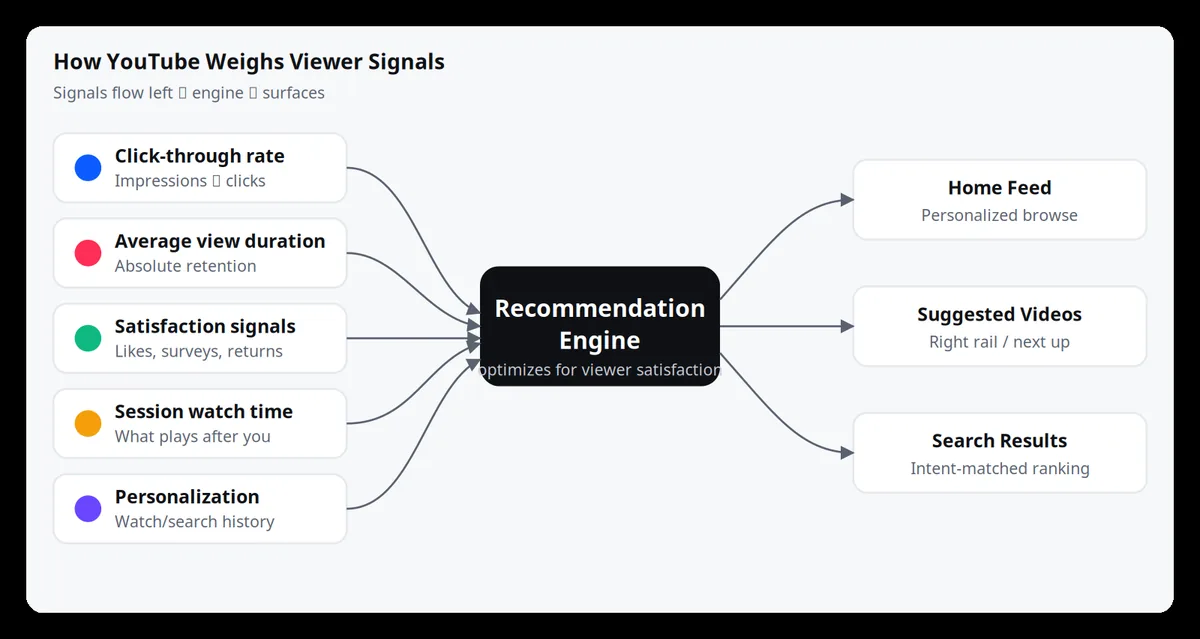
How the YouTube Algorithm Works in 2026 (A Creator's Guide)
How the YouTube algorithm works in 2026: the signals it actually rewards, why retention beats every other metric, and a practical framework creators can use to get more views, watch time, and subscribers.
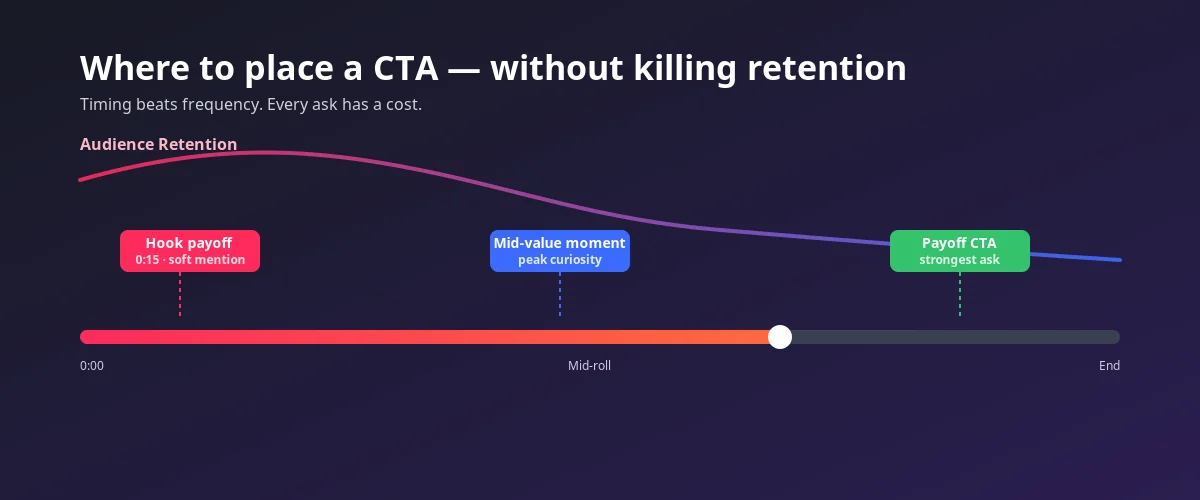
CTAs That Don't Kill Retention: Where to Ask for the Subscribe
A data-driven guide to YouTube CTA placement. Learn exactly where — and when — to ask for the subscribe without killing audience retention, watch time, or session signals.
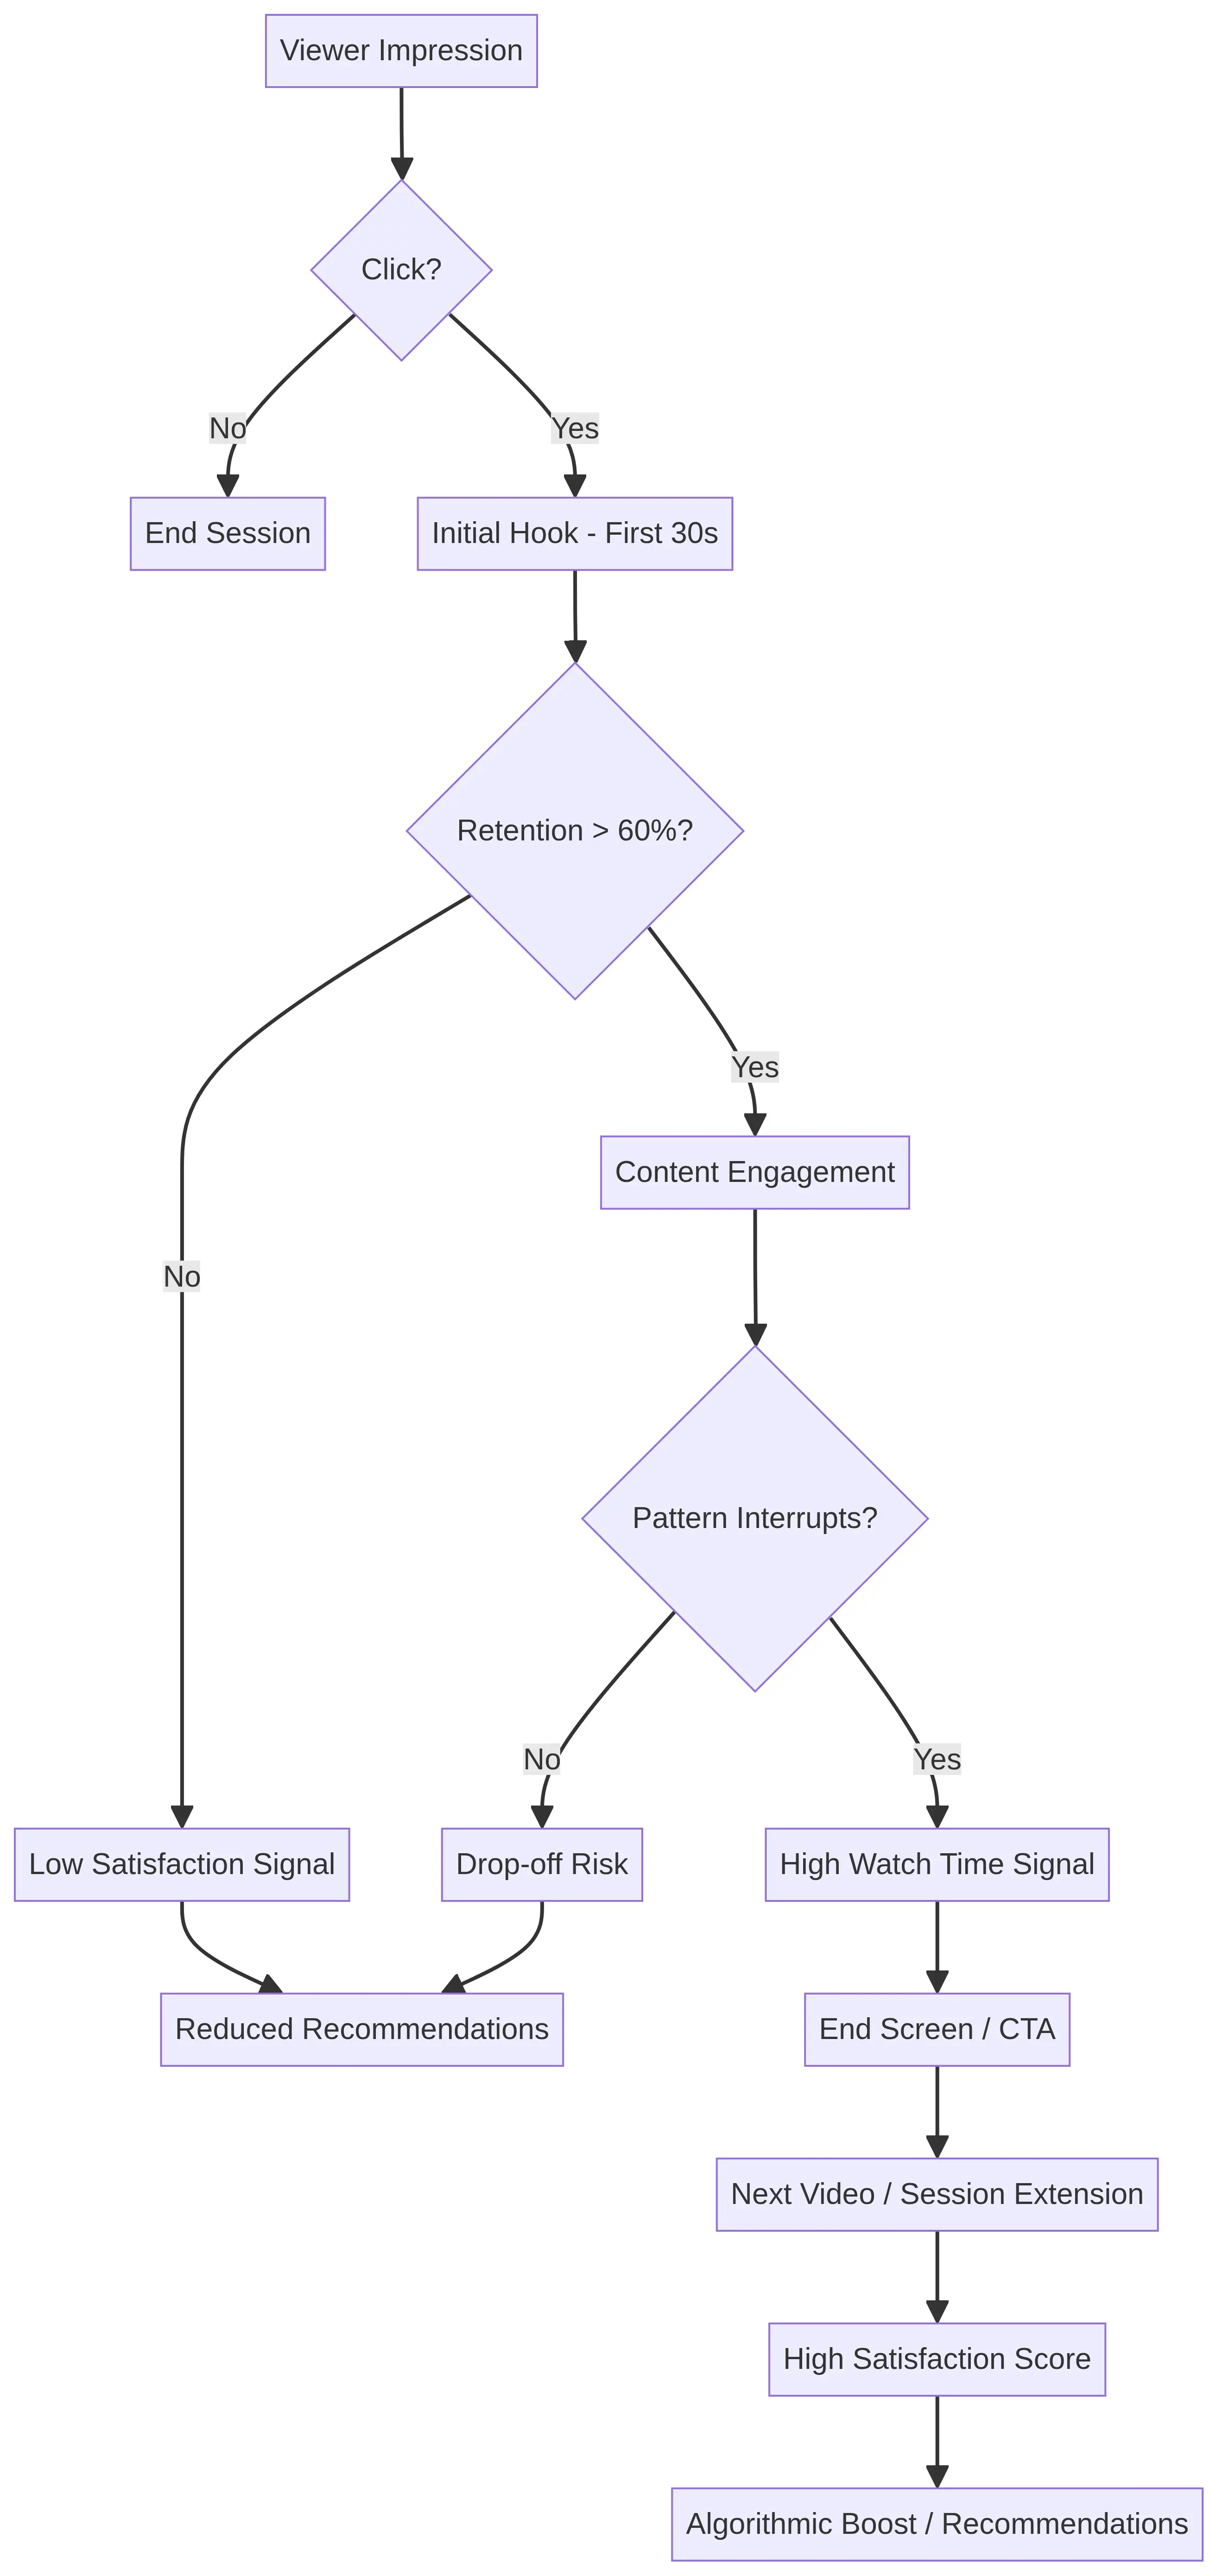
How to Get More Views on YouTube (the Retention-First Way)
Stop chasing trends. Learn how to get more views on YouTube by focusing on audience retention. Discover the algorithm secrets and practical strategies for growth in 2026.