5 Ways to Improve Your YouTube Audience Retention
Audience retention is the #1 signal YouTube uses to promote videos. Learn 5 proven, data-backed ways to improve YouTube audience retention — hooks, pacing, re-hooks, structure and analytics tactics.

37 min read
Audience retention is the single biggest signal YouTube uses to decide whether to promote your video. This guide breaks down five concrete, tested techniques that keep viewers watching — from the first-30-seconds hook to the mid-video slump — with real curves, benchmarks, and a diagnostic framework you can apply this week.
Category:
Introduction
If you have ever uploaded a video that felt like your best work and then watched it fizzle in the recommendations, you are not alone — and you are almost certainly looking at a YouTube audience retention problem, not a topic problem. Retention is the metric that decides whether YouTube shows a video to a hundred people or a hundred thousand. It is the number the algorithm optimizes around, the number growth coaches keep coming back to, and the number that separates channels that scale from channels that plateau.
This guide is written for creators who have grown past the "just publish more" phase and are now trying to make each video work harder. We will unpack what audience retention actually measures inside YouTube Analytics, how the algorithm interprets your retention curve, and — most importantly — five concrete ways to raise it on your next upload. Every technique here is drawn from patterns we see across thousands of channels analyzed inside RetentionYT, our retention diagnostic and script-improvement platform.
Along the way you will see real curve shapes, side-by-side comparisons, retention benchmarks by niche, and a diagnostic framework that maps drop-off patterns to their root cause. By the end you should be able to open your next video's analytics page, spot the exact moment viewers left, and know what to change in the next script.
What you will learn
How to read the retention graph, diagnose the top three drop-off patterns, apply five retention-boosting techniques, and benchmark your channel against your niche.
A quick note on scope. This is a working guide, not an overview. Everything in it is meant to be applied to the next video you upload — not admired from a distance. If you are new to YouTube retention as a concept, start with the definitions in the next section; if you have been reading Studio for years, skip straight to diagnosing drop-off and then the five techniques. We have deliberately structured the article so each section stands alone, in the same way a well-structured video should let a mid-video viewer arrive and still get value.
One more thing worth stating up front: retention is not a personality metric. It is not a measure of whether you are entertaining, likable, or good at speaking to camera. It is a structural measurement of whether the promise your title makes is being kept, minute by minute, second by second. Two creators with identical charisma can produce wildly different retention curves on the same topic — the difference is almost always in structure. That is good news, because structure is learnable.
What audience retention really measures
Audience retention is the percentage of a video that the average viewer watches. If your ten-minute video has an average view duration of five minutes, your retention rate — sometimes called average percentage viewed — is 50%. That single number rolls together thousands of individual viewing sessions into one signal the algorithm can act on.
Inside YouTube Studio you will encounter three closely related metrics. Understanding the difference matters because each answers a slightly different question:
| Metric | What it measures | Best used for |
|---|---|---|
| Average view duration | Minutes and seconds the typical viewer watches | Comparing videos of similar length |
| Average percentage viewed | Percent of the video the typical viewer watches | Comparing videos of different lengths |
| Absolute audience retention | % of viewers still watching at each moment | Finding the exact drop-off timestamps |
| Relative audience retention | Your curve vs YouTube videos of similar length | Judging performance against the platform baseline |
The watch percentage matters more than raw duration in most cases because it normalizes across video lengths. A six-minute video with 60% retention and a twelve-minute video with 60% retention are both telling YouTube the same thing: viewers who clicked found what they came for and stayed for it. That is the message the algorithm rewards.
Retention is not a vanity metric. It is the closest thing YouTube has to a proxy for "was this video worth watching?"
The two lenses: absolute vs relative retention
Absolute and relative retention answer two different creator questions. Absolute retention tells you what actually happened — how many people were watching at each moment. Relative retention tells you how that compares to the rest of YouTube. When absolute retention is high but relative retention is low, your niche norm is even higher and there is still room to grow. When absolute retention is average but relative is well above average, YouTube's algorithm treats you as an over-performer and rewards you accordingly.
New creators tend to obsess over absolute numbers; experienced creators optimize for relative. That single mindset shift — compete against comparable YouTube videos, not against 100% — is one of the most reliable predictors of channels that break through the recommendation ceiling.
Why retention is upstream of every other channel metric
Every metric that matters on YouTube is downstream of retention. Impressions come from the algorithm's confidence in your video, which is calculated from retention. Click-through rate is judged relative to the retention that follows the click. Subscriber conversion happens most often at moments of high retention, not low. Comment velocity correlates almost linearly with retention past the halfway point. Even revenue-per-mille (RPM) is affected — advertisers pay more for placements on videos with strong retention because their ads run longer before viewers leave.
Improve retention and every other metric on your dashboard rises with it. Improve any other metric and retention rarely moves. This is the asymmetry that makes retention the correct place to focus your optimization energy.
How YouTube uses retention to rank videos
YouTube's ranking system is often described as a black box, but its core objective is public and consistent: maximize the total time users spend on the platform per session. Every recommendation decision — Home feed, Suggested, Search, Shorts feed, Browse features — is a bet that a specific video will keep a specific viewer watching for longer than the alternatives.
Watch time is the aggregate output of that bet. Retention is the input the algorithm uses to predict watch time before it has enough data. When your video launches, YouTube shows it to a small test audience and measures three things almost immediately:
- Click-through rate — did the thumbnail and title earn attention?
- Early retention — did the first 30 to 60 seconds hold that attention?
- Session behavior — did the viewer stay on YouTube afterward?
If the early retention signal is weak, promotion slows within hours. If it is strong, the video is pushed to progressively larger audiences. This is why two videos on the same topic can end up with 1,000 and 1,000,000 views respectively — the algorithm treated one as a session-extender and the other as a session-ender.
Best practice
Treat the first 24 hours after publishing as a live experiment. If your absolute retention at 30 seconds is under 65%, your ceiling is already capped. Prioritize improving the intro on your next upload rather than promoting the current one harder.
Crucially, YouTube compares your retention curve to the curves of other videos with similar length, topic and audience. This is the "relative audience retention" score in Studio. A 45% average may be excellent in one niche and mediocre in another — which is why the benchmark table below is more useful than any single number.
Session-level watch time: the metric behind the metric
There is one metric YouTube cares about more than any single video's retention: session watch time. That is the total time a viewer spends on YouTube after starting your video — including the videos they watch next. A video with 45% retention that leads viewers to three more YouTube videos is more valuable to the platform than a video with 65% retention that ends the session.
You cannot directly measure session watch time as a creator, but you can influence it. End screens that suggest logical next videos, content that opens curiosity loops the viewer can only close by watching more of your content, and topics that ladder naturally into related searches all raise session watch time. When two of your videos have identical retention but one gets pushed harder by the algorithm, session behavior is usually the invisible tiebreaker.
The retention-CTR flywheel
Click-through rate and retention are often taught as separate optimizations. In practice they behave as a flywheel. A high CTR without matching retention teaches the algorithm your thumbnail is misleading and the video will be throttled within days. High retention without CTR simply never gets tested at scale. The videos that break out are the ones where CTR earns the impression and retention justifies pushing the video to a wider audience.
Practical implication: never optimize thumbnail and title in isolation from the video's opening 60 seconds. A clickable thumbnail that overshoots the delivery of the intro is worse than a slightly less clickable thumbnail that matches. This is where many channels burn goodwill with the algorithm — chasing CTR at the expense of the promise the intro can keep.
Reading the retention graph
The retention graph in YouTube Analytics is one of the most under-read charts in creator tools. Most creators glance at the final percentage and move on. But the shape of the curve tells you more than the number ever will. Three canonical shapes cover about 90% of what you will encounter.
The flat curve — you have found product-market fit
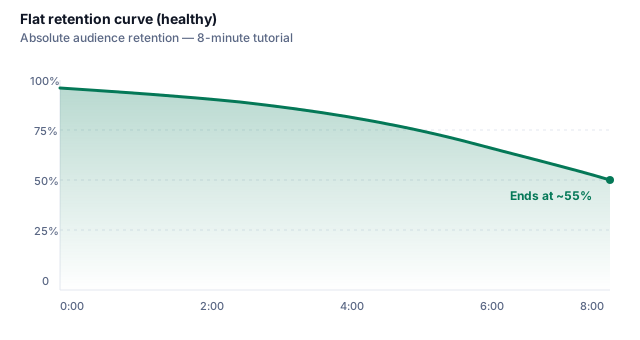
A gently declining, near-horizontal curve means the promise made by your title and thumbnail lines up with the delivery. Tutorials, deep dives and well-scripted explainer videos frequently show this shape. If you have found a flat curve for a topic, double down on that format — the algorithm will keep pushing it.
The cliff — your hook is not landing
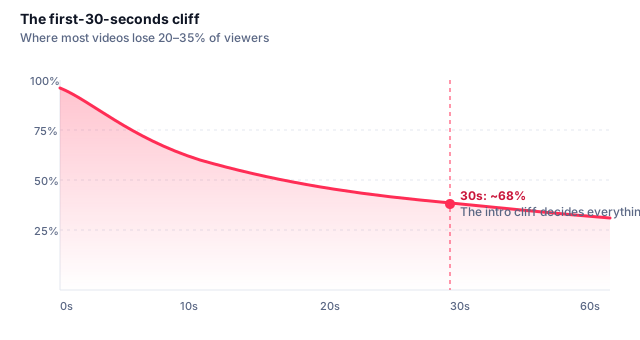
A steep drop in the first 15–30 seconds followed by a shallower decline is the most common problem shape. This is not a content problem, it is an intro problem. The viewers who stayed past the cliff usually watch just fine — they just needed a reason to. We cover fixes in Way #1.
The rising curve — replay signal
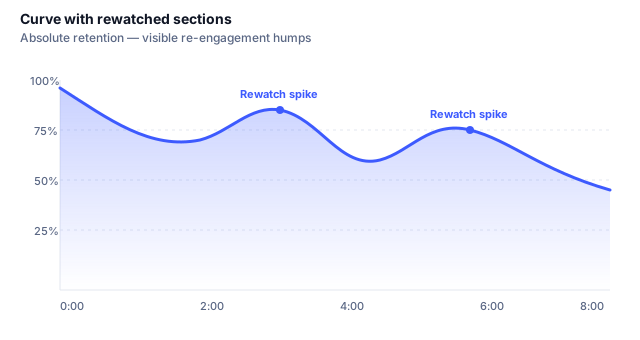
A curve that spikes upward at specific moments indicates viewers scrubbed back to rewatch something. This is one of the strongest positive signals on YouTube. Look at those timestamps: whatever you did there — a specific reveal, a joke, a data point — is worth repeating and expanding.
The mid-video slump
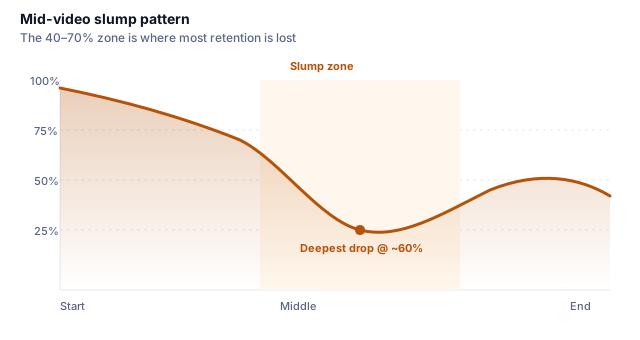
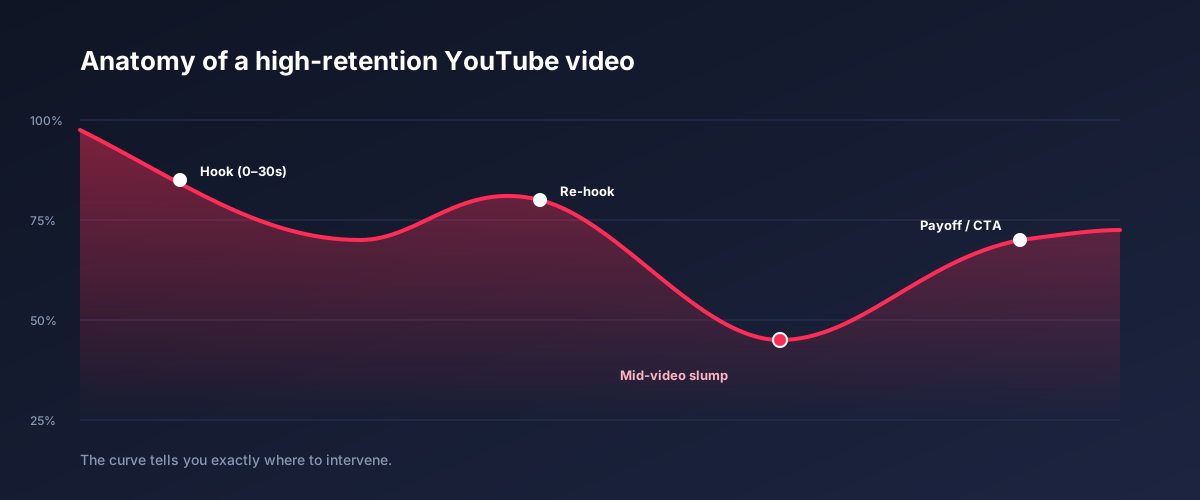
If your curve looks fine for the first two minutes then collapses between the 40% and 70% marks, you have a mid-video slump. This is a pacing and structure problem — the promise of the video has already been mostly delivered, and viewers no longer have a reason to keep watching. Way #2 is dedicated to fixing exactly this.
The end-of-video plateau
A less-discussed but useful shape is the plateau: retention that stabilizes and remains flat for the last 20–30% of the video, sometimes at surprisingly high values. This is the shape of a video that found its true audience — the viewers who stayed have essentially committed to finishing. If you see this shape, look at what happens right before the plateau begins. Usually there is a specific moment — a reveal, a promise fulfilled, or a strong emotional beat — that filtered out casual viewers and locked in the fans. That is the moment worth replicating.
Reading spikes vs dips
Every meaningful movement on the curve deserves attention, but spikes and dips carry different information. Dips almost always signal something the viewer disliked — a topic detour, an unexpected sponsor read, a section that felt off-topic. Spikes upward signal replay behavior, which is one of the algorithm's strongest positive engagement inputs. When you find a replay spike, do not just note it — study the 10 seconds before it. Something in that setup made viewers scrub back. Repeat that pattern deliberately in future videos.
Diagnosing where viewers drop off
Before you can improve retention, you have to know where you are losing it. Every drop-off event has a cause, and once you have seen a few dozen curves you will start to recognize the fingerprints of each root cause almost instantly.
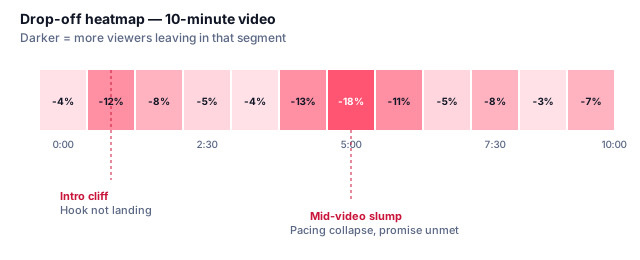
The four drop-off fingerprints
- Sharp vertical drops — an edit or transition that broke the viewer's expectation (a mid-roll ad, a jarring cut, a sponsor read that came too early).
- Gradual slopes downward — pacing fatigue, meaning individual moments are fine but nothing is compelling continued attention.
- Wide V-shapes — a segment felt like a detour. Viewers left, some returned.
- Long flat plateaus at low retention — you have found your true fans. This is the audience that will always finish.
Once you have identified the shape, hover over the exact timestamp in YouTube Analytics and rewatch the 15 seconds around it. In roughly nine out of ten cases the reason will be obvious in hindsight: a pointless intro card, a filler transition, a topic switch you thought was seamless, an over-long sponsor read. If it is not obvious, that is where RetentionYT is designed to help — it overlays your script and edit list onto the retention curve so the cause behind each drop is annotated automatically.
Warning
Do not obsess over the drop-off at 100% of the video. Every video ends. What matters is the shape between 0% and 90%, not the moment the credits roll.
Cross-referencing retention with the traffic-source breakdown
The same video can have wildly different retention curves depending on where viewers came from. A viewer who arrived via YouTube Search typed the topic in — they came with intent and usually retain well. A viewer who arrived via the Home feed was served the video passively — they retain more like the average YouTube viewer. Suggested-video traffic sits in between, biased toward the channel's existing audience.
Inside YouTube Analytics, always cross-reference retention with the traffic-source breakdown. A video that retains 60% from Search but only 32% from Home is not underperforming — it is being tested by the algorithm on an audience that does not yet know the channel. The correct interpretation is that the topic is strong but the packaging (thumbnail and title) needs to convert cold traffic better. Without the cross-reference, you might rewrite the wrong part of the video.
Diagnosing new-viewer vs returning-viewer retention
New viewers and returning subscribers watch differently. Subscribers already trust the channel and forgive slow intros; new viewers do not. If your subscriber retention is high but new-viewer retention is weak, the fix is almost always in the opening 60 seconds. If both are weak, the problem lies deeper — in structure, pacing, or the promise itself. Splitting the two views before you diagnose saves days of chasing the wrong lever.
The 5 ways to improve YouTube audience retention
Below are five techniques in the order we recommend applying them. Each one is independent — you can start with whichever matches your current curve shape — but they compound powerfully when applied together. Every technique addresses a specific mechanism inside the retention curve.
- Fix the first 30 seconds — because the intro cliff caps every other improvement.
- Hold the middle with pattern interrupts — because the mid-video slump is where most retention dies.
- Engineer a promise-payoff loop — because open loops are the strongest form of retention gravity.
- Pace edits to viewer attention — because attention decays predictably and edits reset it.
- Close the analytics feedback loop — because compounding beats guessing.
Way #1 — Fix the first 30 seconds
The first 30 seconds is the single highest-leverage segment of any YouTube video. In the retention audits we run at RetentionYT, a typical video loses roughly a fifth of its audience in the first 30 seconds and nearly a third by the 60-second mark — while the strongest openings lose less than 10% in that same window.
What actually happens in the first 30 seconds
Every viewer arrives with a specific question in mind — the question your title implied. They spend the first few seconds asking: "Is this video going to answer that question, and can I trust the creator to answer it well?" If the intro delays the answer, questions the viewer's intent, or spends time on branding, they leave. On mobile, the leaving mechanic is a single upward swipe.
Three intro patterns that consistently work
- Cold open on the payoff — start with the result, the moment, or the visual that the title implied. Explain how you got there afterward.
- Contract intro — in one sentence, state what the viewer will know or be able to do by the end. Add a specific number if you can ("by minute six, you will have a working script").
- Question-with-tension — open with the specific question the video answers, framed sharply enough that a viewer with that question feels seen.
Three intro patterns that consistently fail
- Long animated intros — every logo bumper is a retention tax you cannot afford.
- "Hey guys, welcome back to the channel" — every viewer who does not already know you leaves.
- Housekeeping before hook — "before we get started, don't forget to like and subscribe" is the fastest way to trigger the intro cliff.
Best practice
Write the intro last. Once the rest of the video exists, you know exactly what payoff to tease and exactly what promise to make.
Every rewrite of the first 30 seconds is worth more than a rewrite of the next four minutes combined. If you only apply one technique from this article, apply this one — and measure the delta in absolute retention at the 30-second mark on your next upload.
A concrete rewrite exercise
Take the intro of your last three videos and transcribe them word-for-word. Now count the number of words before the first specific, concrete piece of information the viewer receives. If that count is above 25, your intro is too long. Rewrite each intro so the first concrete piece of information arrives inside the first 12 words. This alone typically raises 30-second retention by 5–8 percentage points on the next upload.
A useful test: read the first three sentences of your intro out loud to someone who has never seen your channel. Ask them, in one sentence, what the video is about. If they cannot answer, the intro has failed regardless of how good it sounds to you. The viewer needs the answer to that question inside the first 15 seconds — not by the end of the intro, not by the end of the first section, but early enough that the leaving decision is made in your favor.
What about pattern breaks in the intro itself?
A common intermediate-creator move is to jam multiple hooks into the first 15 seconds: a cold open, then a quick teaser, then a montage, then the contract intro. This usually backfires. The viewer's brain reads it as a stalling tactic and the retention curve drops harder, not softer. One clean hook that leads directly into the first piece of substance outperforms a stack of clever openings almost every time.
Way #2 — Hold the middle with pattern interrupts
The mid-video slump — usually the 40–70% mark — is where the second-largest chunk of retention is lost. The dynamic here is different from the intro. Viewers who reach the middle already trust you, so they are not looking for a reason to leave. They are simply losing the reason to stay. The countermeasure is pattern interrupts: small, deliberate changes in the video's rhythm that reset attention without breaking the flow.
The five pattern interrupts we see work most consistently
- Visual reset — a b-roll cut, a change of location, a graphic overlay, or simply zooming in or pulling back.
- Verbal reset — a callback to the promise ("remember what I said we would prove at the start? Here is where that happens"). This is a re-hook.
- Data reveal — a chart, a benchmark, a specific number. Numbers reliably re-engage attention because they promise concreteness.
- Contrarian statement — introducing an idea that contradicts what most viewers assume. Attention rises whenever the brain detects a possible error in its model of reality.
- Micro-story — a 30–45 second concrete story woven into the argument. Stories are the oldest attention technology we have.
Well-retained videos typically deploy a pattern interrupt every 40–60 seconds in the middle third. Not every one has to be dramatic — even a change in shot composition, a stand-up-and-move edit, or a shift in vocal energy counts. The mistake to avoid is running two minutes of flat delivery without a single reset. That is when the curve collapses.
Attention is not spent evenly. It is spent in bursts, and every edit is a chance to refuel it.
When we run script diagnostics inside RetentionYT, the first thing the system flags is the longest interval between pattern interrupts in the middle third. If that interval is over 60 seconds, the mid-video slump on the finished video is almost guaranteed. The tool then suggests where to slot in a re-hook, a b-roll opportunity, or a data callout — before the video is recorded.
The re-hook: the single most under-used tool in long-form YouTube
Of the five pattern interrupts, the verbal re-hook is the one most creators are missing. A re-hook is a mid-video sentence that reasserts the promise and previews the payoff still to come. It sounds obvious in writing, but in practice it is almost always missing. Watch any high-retention long-form video and you will find at least two re-hooks — often three. They are usually 5–10 seconds long, delivered with slightly elevated energy, and immediately followed by the next substantive beat.
Examples of re-hook phrasing that consistently perform well:
- "Before I show you the last technique — which is the one that made the biggest difference — there is one more thing that has to happen first."
- "I promised at the start that I would prove this with data. That is what the next section does."
- "If you have watched this far, you already understand more about retention than 95% of creators. Here is what separates the last 5%."
Each of these does three things in one sentence: acknowledges the viewer's investment, reminds them of the open loop, and previews the payoff. That combination is close to the strongest retention move available in long-form video.
Way #3 — Engineer a promise-payoff loop
The strongest retention gravity is not entertainment — it is open loops. An open loop is any unresolved promise inside the video that the viewer's brain wants to close. Great creators layer three or four open loops across a video so that at any given moment at least one is still unresolved. This keeps the "what comes next" question alive continuously.
How to open a loop early
- Tease the payoff — "later in this video I'm going to show you the one intro pattern that works on 90% of scripts."
- Introduce a mystery — "there is one number in this dataset that shouldn't be there. Watch for it."
- Promise a comparison — "at the end I'll compare these two side-by-side so you can see which one wins."
How to close loops without deflating retention
Closing a loop is powerful but dangerous. As soon as the payoff arrives, whatever gravity that loop was creating disappears. If it was the only loop open, retention drops immediately after. So always open the next loop before closing the current one:
- Reference the promise ("okay, this is the payoff I teased earlier…")
- Deliver it fully — do not shortchange it, this is the trust moment.
- Immediately open the next loop ("but there is one more thing that changes when you do this…").
Tip
Sketch your loop map before you write the script. A ten-minute video should have three to five loops, staggered so at any moment at least two are unresolved.
This is the mechanic behind virtually every high-retention long-form YouTube video. It is not a stylistic flourish — it is structural. When we A/B test scripts inside RetentionYT, adding one additional well-placed loop can shift average percentage viewed by three to seven points on the same underlying content.
Three loop archetypes to steal
Not all loops are created equal. Three archetypes come up again and again in the highest-retention videos we analyze:
- The reveal loop — "By the end of this video, you are going to see the specific number that changed everything." The viewer stays because they want the number.
- The comparison loop — "I tested three approaches. Only one of them works. I will show you all three, but the third one is the surprise." The viewer stays because they want the ranking.
- The mystery loop — "There is one detail in this data that does not fit. Watch for it." The viewer stays because they want to solve the puzzle.
Notice that all three loops are specific. Vague loops ("stick around for something amazing") no longer work; audiences have been trained to see them as filler. The more concrete the promised payoff, the stronger the retention gravity.
What to do when a loop cannot be closed satisfactorily
Sometimes a loop you opened cannot be closed in a satisfying way — a test result came in inconclusive, an interview subject changed their mind, an experiment failed. Do not paper over it. Instead, close the loop honestly and reframe the failure as a lesson. Viewers reward transparency with higher retention on the following video, not lower. What kills retention is loops that get quietly abandoned or resolved off-camera. If a loop opens, close it visibly.
Way #4 — Pace edits to viewer attention
Attention is not a constant. It decays second by second, especially when the visual and auditory signal remains unchanged. Every edit — a cut, a zoom, a graphic, a change of voiceover pace — resets the decay curve. Great video pacing is the deliberate management of that decay.
The three-second rule (with nuance)
A commonly cited guideline is "no shot longer than three seconds." Like most rules of thumb, it is directionally true and technically wrong. Very slow, story-driven videos routinely hold shots for 15–30 seconds and retain fine. The real principle is: the visual should change often enough that the viewer never wonders whether the video has ended. In fast tutorial content, that is often every 2–4 seconds. In documentary content, it can be every 15.
Pacing signals to audit
- Shot length variance — variety of shot durations matters more than short shots.
- Cut on motion — cuts that align with movement feel invisible; cuts on stillness feel jarring.
- B-roll density — for talking-head videos, one b-roll insert every 6–10 seconds is a workable baseline.
- Audio texture — music, sfx, and silence changes are as effective as visual edits at resetting attention.
- Verbal pacing — varying sentence length and speaking rate is the cheapest edit you have.
The retention curve rewards pacing that matches your content, not pacing that is uniformly fast. A retention drop across a slow segment does not always mean the segment was too slow — it might mean the segment was slow when the viewer expected fast, or vice versa. Diagnose against your title's implied energy, not against a universal ideal.
The audio-first pacing test
Here is a diagnostic almost no one runs: listen to your video with your eyes closed. Every place your attention wanders is a place a viewer's attention wandered too. Audio pacing — voice modulation, sound design, music cuts, deliberate silence — carries more of the retention load than most creators realize. In talking-head content specifically, audio pacing is usually the single largest predictor of whether the middle third holds.
Two common audio-pacing mistakes:
- Monotone delivery across long passages. Even great writing dies under a flat vocal track.
- Background music that never changes. If the same loop plays from 0:30 to 8:00 unchanged, viewers stop hearing it, which means they also stop feeling the momentum it was meant to provide.
Cutting for the algorithm vs cutting for the viewer
There is a temptation to over-cut every video to look "fast-paced." Do not confuse activity for pacing. Rapid-fire cuts on flat content read as anxious, not energetic, and often accelerate the drop-off rather than slowing it. Cut when the content demands it. Hold when the moment deserves weight. The best pacing decisions are content-first, not aesthetic-first.
Way #5 — Close the analytics feedback loop
The single biggest difference between channels that scale and channels that plateau is not talent or budget — it is the tightness of the analytics feedback loop. Growing creators publish, analyze, adjust, and republish on a short cycle. Stalled channels publish, glance at views, and repeat.
A minimum-viable retention review process
- 48 hours after publishing — screenshot the absolute retention curve. Note retention at 15s, 30s, 60s, and the halfway point.
- Day 7 — record steady-state retention and relative audience retention.
- Monthly — plot the trend for each metric across the last 10 videos. Look for the direction, not the level.
- Every quarter — cluster your top three and bottom three videos and ask what structural elements they share.
Most creators who claim retention is "unpredictable" have simply never plotted the trend. Once you have ten videos annotated with what you deliberately changed, patterns emerge quickly — and the patterns are almost always different from what you would have guessed. This is exactly the workflow RetentionYT's retention report is built to accelerate: your last 30 uploads, ranked by curve shape, with per-video annotations for hook type, pacing profile and loop count.
The one-variable rule
The reason most retention iteration fails is that creators change five things at once and then cannot tell which change moved the number. Adopt a strict one-variable rule: change exactly one structural element per upload for at least three consecutive videos, then evaluate. It feels painfully slow. It is dramatically faster than the alternative, which is guessing forever.
Good candidate variables to isolate: intro length, first sentence structure, number of open loops, pattern-interrupt density, b-roll density, mid-video re-hook placement, sponsor timing, outro length. Bad candidates: topic, thumbnail style, upload day — these are legitimate levers but they contaminate the retention signal because they change who watches.
Building a personal retention playbook
After 20–30 iterations you will have accumulated enough evidence to write a channel-specific retention playbook. This is the compounding payoff. Your playbook will not look like anyone else's, and that is the point — it encodes what works for your audience, on your topics, at your length. Creators who have this playbook rarely go viral on any single video, but their channels grow roughly linearly forever, because every upload benefits from every previous experiment.
Diagnose your retention in minutes, not weeks
RetentionYT ingests your channel's analytics, overlays your scripts on the retention curve, and tells you exactly where viewers left — and why. Every insight ships with a specific fix you can apply to your next upload.
Start a free retention audit
Case example: before vs after
To make the framework concrete, here is a real (anonymized) mid-size channel — a personal-finance creator with about 180,000 subscribers — that applied the five techniques above across six consecutive uploads. Their baseline was 34% average percentage viewed on 9-minute videos. Their target was 50%.
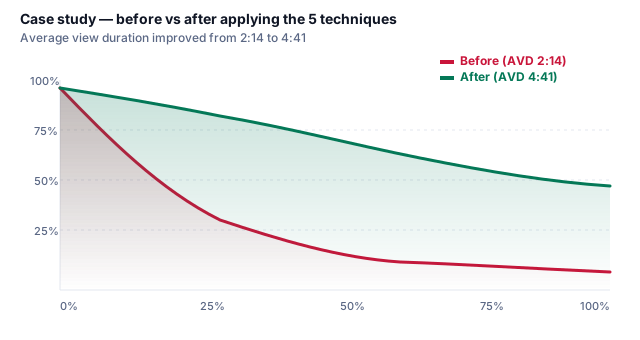
What changed, video by video
| Video | Change applied | 30s retention | AVD | APV |
|---|---|---|---|---|
| Baseline | — | 66% | 2:14 | 34% |
| #1 | Cold open + contract intro | 78% | 2:52 | 38% |
| #2 | Added 3 pattern interrupts in middle | 79% | 3:20 | 42% |
| #3 | Two staggered open loops | 82% | 3:48 | 45% |
| #4 | B-roll density doubled | 84% | 4:05 | 48% |
| #5 | Removed housekeeping + sponsor moved later | 87% | 4:24 | 51% |
| #6 | All techniques combined + tightened cold open | 89% | 4:41 | 54% |
Two details are worth noting. First, the 30-second retention improved on every single video, even when other metrics briefly plateaued — the intro was the compounding lever. Second, average view duration doubled while the video length stayed roughly the same. The channel's total watch time per view — the metric YouTube actually optimizes — more than doubled.
Impressions from Browse and Suggested rose 3.4× across the same six-week window. The channel did not change its topic, format, thumbnail style, or upload schedule. It only changed how it structured the inside of the video.
Retention benchmarks by niche and length
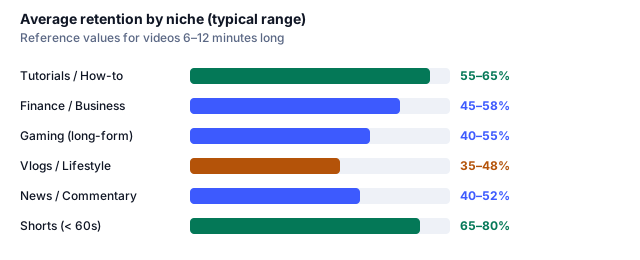
Benchmarks matter because a "good" retention rate depends on what you make and how long it is. The numbers below are typical ranges for videos 6–12 minutes long, drawn from RetentionYT's 2026 dataset. Use them as reference points, not targets. Beating the low end of your niche should be table stakes; the top of the range is where recommended-tab growth kicks in.
| Niche | Typical APV (6–12 min) | Top-quartile APV | Notes |
|---|---|---|---|
| Tutorials / How-to | 55–65% | 70%+ | High intent traffic; expect the flat curve. |
| Finance / Business | 45–58% | 65%+ | Loop-heavy scripts win here. |
| Gaming (long-form) | 40–55% | 60%+ | Pacing and audio texture matter most. |
| Vlogs / Lifestyle | 35–48% | 55%+ | Narrative structure beats production value. |
| News / Commentary | 40–52% | 60%+ | First 30 seconds is everything. |
| Shorts (< 60s) | 65–80% | 90%+ | Loop-back plays inflate the number. |
Retention by video length
Long videos have a natural retention penalty, but a smaller one than most creators assume. On the same channel with the same audience, doubling the length usually costs about 5–10 percentage points of APV — well worth it if the topic genuinely deserves the length. The wrong move is to make short videos long. The right move is to make long videos when the topic can carry the weight.
| Video length | Typical APV range | Watch-time impact |
|---|---|---|
| Under 3 min | 55–70% | Low total watch time; strong for Shorts feed spillover |
| 3–6 min | 50–62% | Balanced; safe for most niches |
| 6–10 min | 45–55% | Sweet spot for mid-roll monetization |
| 10–20 min | 38–50% | Highest total watch-time potential when retention holds |
| 20+ min | 30–45% | Requires narrative structure and strong loop management |
Actionable framework: the SCOPE loop
The techniques above condense into a repeatable workflow we call SCOPE — Structure, Cliff, Open loops, Pacing, Evidence. Run every script through it before recording.
- S — Structure: Sketch the promise, three main beats, and the payoff before writing a single line of narration.
- C — Cliff: Rewrite the first 30 seconds until removing any sentence would weaken the promise.
- O — Open loops: Layer three to five loops so at least two are open at any moment.
- P — Pacing: Insert a pattern interrupt every 40–60 seconds in the middle third. Vary shot length and audio texture.
- E — Evidence: End with a specific, memorable payoff — a chart, a comparison, a number. Not a generic wrap-up.
SCOPE is not a rigid template. It is a diagnostic — a way to verify, before you spend hours filming, that the retention mechanics are load-bearing. Run every future script through it. Iterate. The compounding is fast.
Checklist for creators
Print this and keep it near your editing setup. Every "no" is a retention lever you have not yet pulled.
- My cold open lands on a payoff, a contract, or a sharp question within the first 5 seconds.
- My intro has zero housekeeping and zero animated bumper.
- My 30-second absolute retention on similar videos is above 75%.
- I have at least three open loops mapped across the video.
- No stretch of the middle third goes 60 seconds without a pattern interrupt.
- Every loop I close is immediately followed by opening the next one.
- My b-roll density in talking-head sections is one insert per 6–10 seconds.
- Sponsor reads sit past the 40% mark, never before.
- I know my current APV benchmark for my niche and length.
- I review my retention curve within 48 hours of every publish.
- My last 10 videos' retention trend is going up, not sideways.
- The video is the shortest length that still fully delivers the title's promise.
Frequently asked questions
What is a good YouTube audience retention percentage?
For most niches, an average percentage viewed of 45–55% is considered healthy. Tutorials commonly reach 55–65%, while Shorts often exceed 70%. Anything above 50% for videos longer than eight minutes typically signals YouTube to expand your reach. Always benchmark against your niche and length — a 40% score is a top result for a 20-minute vlog and a below-average result for a five-minute tutorial.
How is average view duration different from audience retention?
Average view duration is measured in minutes and seconds and represents how long the typical viewer watches. Audience retention is the percentage of the video watched. Both matter, but retention normalizes across video lengths and is what the algorithm compares videos on. Watch duration is the raw material; retention is the ratio.
How long should my YouTube video be for the best retention?
The best length is the shortest length that fully delivers on the title's promise. YouTube rewards total watch time, so longer videos can win — but only if retention stays high. If a topic can be covered well in six minutes, do not stretch it to twelve. Length inflation is one of the most common causes of the mid-video slump.
Does the first 30 seconds really matter that much?
Yes. Most videos lose 20–35% of viewers in the first 30 seconds. That cliff sets the ceiling for everything else. A stronger hook, faster payoff and tighter intro editing are the highest-leverage retention improvements you can make.
Can I improve retention on videos I've already published?
Directly editing an existing video will reset its performance history and is almost never worth it. A better approach is to study the retention curve, identify drop-off points, and apply what you learn to your next uploads. Consistent iteration compounds far faster than one-off re-uploads.
How often should I check my retention analytics?
Review retention within 48 hours of publishing (early curve shape), again at seven days (steady-state), and monthly at the channel level. Weekly channel-level trend reviews help you catch content patterns before they become channel-wide problems.
Does adding chapters improve retention?
Chapters improve the viewer experience but usually have a neutral-to-slightly-negative effect on average percentage viewed because they enable skipping. However, they often improve total watch time on longer videos because viewers who would have bounced instead jump to a relevant section. Judge by watch time, not by APV.
Do mid-roll ads hurt retention?
Yes, at the timestamp itself — you will see a vertical drop. The net effect is usually small if placement is chosen carefully. Prefer ad break slots that fall on natural transitions (end of a section, before a promised payoff) rather than mid-sentence.
Conclusion
Improving YouTube audience retention is not a mystical creator skill. It is a set of structural choices — how the first 30 seconds are written, where pattern interrupts fall, how open loops are layered, how tightly you close the feedback loop between publishing and analyzing. Every technique in this article is measurable, testable, and repeatable on the next upload.
The channels that scale on YouTube in 2026 are the ones that treat retention as a design problem rather than a talent problem. Read your curve. Diagnose the drop-off. Apply one of the five techniques. Ship the next video. Then do it again. Six iterations is usually enough to move average percentage viewed by 15–20 percentage points on the same underlying content.
If you want the diagnostic step automated — script-level annotations on your curve, benchmark comparisons, and specific fix suggestions for each upload — that is exactly what RetentionYT is built to do. Start a free audit and see your last 30 videos ranked by curve shape in under two minutes.
Related reading in the Retention category
- What is YouTube audience retention (complete beginner's guide)
- How to read the YouTube retention graph like an analyst
- Hook optimization: the 30-second playbook
- How to fix the mid-video slump in long-form content
- Retention benchmarks by niche (2026 dataset)
- Watch time vs retention: which one should you optimize?
- The YouTube script structure that maximizes retention
- Absolute vs relative audience retention explained
Last updated: August 5, 2026 Reviewed by the RetentionYT editorial team
External references
Frequently asked questions
- How is average view duration different from audience retention?
- Average view duration is measured in minutes and seconds and represents how long the typical viewer watches. Audience retention is the percentage of the video watched. Both metrics matter, but retention normalizes across video lengths and is what the algorithm compares videos on.
- Does the first 30 seconds really matter that much?
- Yes. Most videos lose 20–35% of viewers in the first 30 seconds. That cliff sets the ceiling for everything else. A stronger hook, faster payoff and tighter intro editing are the highest-leverage retention improvements you can make.
- Can I improve retention on videos I've already published?
- Directly editing an existing video will reset its performance history. A better approach is to study the retention curve, identify drop-off points, and apply what you learn to your next uploads. Consistent iteration compounds far faster than one-off re-uploads.
- How often should I check my retention analytics?
- Review retention within 48 hours of publishing (early curve shape), again at seven days (steady-state), and monthly at the channel level. Weekly channel-level trend reviews help you catch content patterns before they become channel-wide problems.
Find your video’s drop-off points before you publish
RetentionYT audits your script for the moments viewers leave — so you can fix them before recording.
Get retention tips in your inbox
Occasional, practical emails on hooks, pacing, and retention. No spam.
Related posts
Pattern Interrupts: How to Reset Viewer Attention Every 45 Seconds
Pattern interrupts reset viewer attention before habituation sets in. Learn the neuroscience, the timing cadence, 14 concrete techniques, and a diagnostic workflow for holding attention.
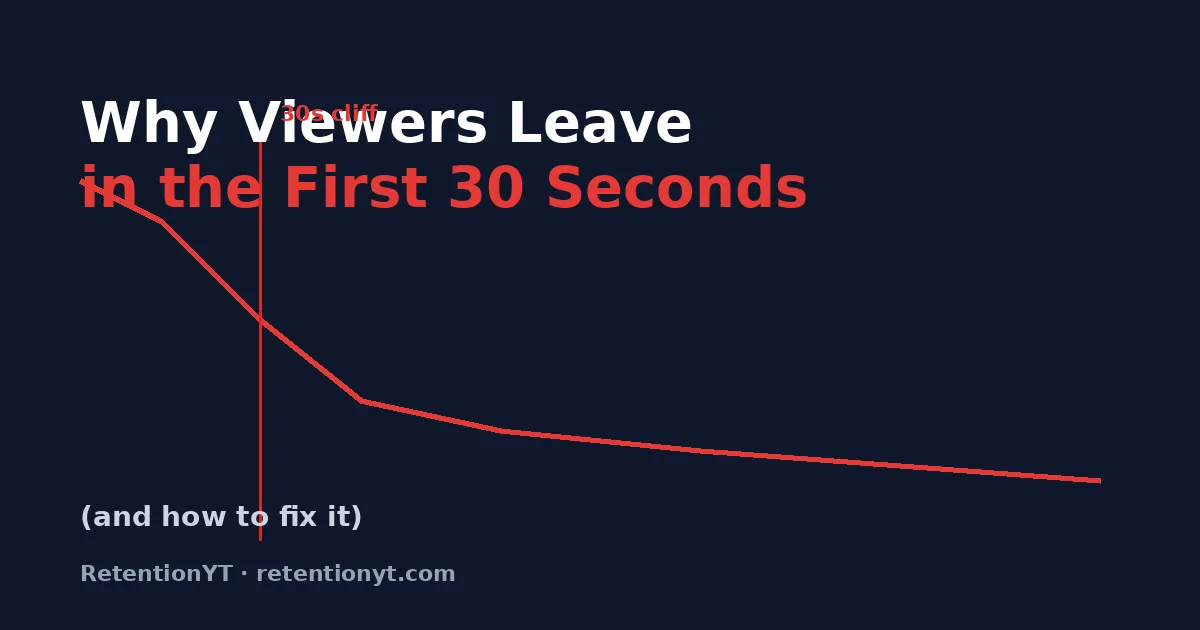
Why YouTube Viewers Leave in the First 30 Seconds (and How to Fix It)
Most viewers leave before your YouTube video really starts. Learn why the first 30 seconds decide watch time, how to read the retention graph, and 14 proven techniques to fix your hook and stop viewer drop-off.
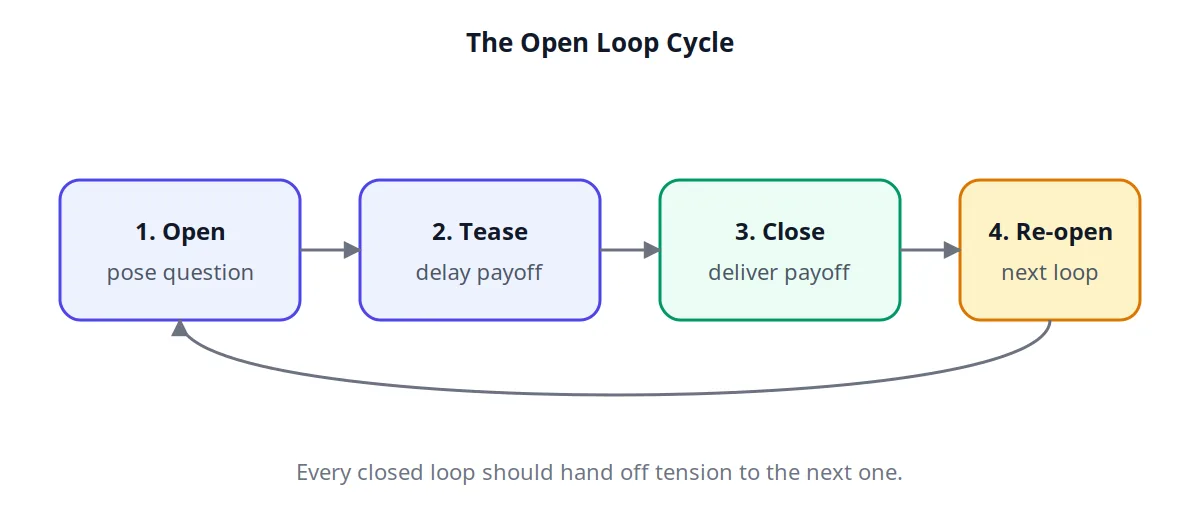
Open Loops: The Retention Trick Top YouTubers Swear By
Open loops are unanswered questions that keep viewers watching. Learn how top YouTubers use open loops to boost audience retention, hold the mid-video slump, and increase watch time — with concrete scripts, benchmarks, and a repeatable framework.