How to Use YouTube's Typical Retention Comparison Line
Use YouTube's typical retention comparison line to read your graph, find the moment that trails similar-length videos, and choose the next rewrite without fake benchmarks.

9 min readUpdated
In this guide
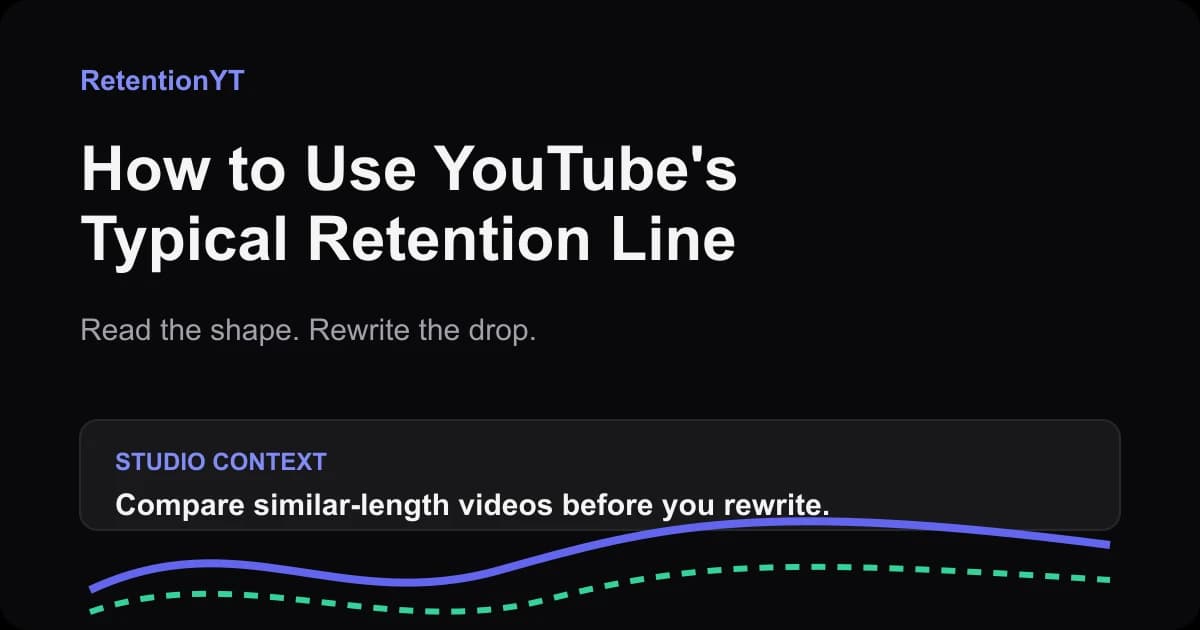
If the grey line is above your curve at 0:15, inspect the opening before blaming distribution. If your curve is above it at 0:30 but falls away at 6:00, inspect the middle. YouTube's comparison is for similar-length videos, so use the line to choose a question—not to chase a universal percentage table.[^1]

What How to Use YouTube's Typical Retention Comparison Line actually is (and what it is not)
The typical retention line is a reference drawn beside your current video's audience-retention curve. In plain language, it answers: “How does this moment compare with my recent videos that are about the same length?” YouTube says the comparison uses your 10 latest videos of similar length (YouTube Help, August 2026). That is the useful part: the comparison set is closer to your own format than a random table copied from a blog.
It is not a target that every second must beat. It is not a published “good retention” number for every creator. It is not proof that the algorithm rejected a video. The line gives you context; the curve, timestamp, transcript, cut, and on-screen promise give you the material to investigate.
| What you see | What it tells you | What to do next |
|---|---|---|
| Your curve stays above typical | This stretch is holding better than the comparison context | Identify the promise, proof, or pacing beat worth repeating |
| Your curve hugs typical | This stretch is not giving you a clear separation | Look for a small experiment instead of forcing a dramatic rewrite |
| Your curve drops below typical | This stretch deserves inspection | Match the timestamp to the script, edit, visual, or promise |
Why this shows up in YouTube Studio
YouTube Studio puts retention inside the wider analytics workflow. On desktop, the current YouTube Help instructions place Analytics in the left menu and Content in the top menu; the Videos area includes Key moments for audience retention and says that typical retention can compare your 10 latest videos of similar length.
The locked SOURCE 1 page currently opens as YouTube's Reach help page, not a page titled Audience retention. It does document a selected-video path through Content and Analytics, and it warns that some reports may not be available on mobile. I use it here only for that navigation context, not as support for a typical-retention formula.SOURCE 1

Worked example 1: the failure
Here is an illustrative failure, not a YouTube dataset. A four-minute tutorial opens with a logo animation, a greeting, and a promise that the useful part is coming. At 0:08, the current curve is visibly below the dashed typical line. At 0:30, it has not recovered.
The mistake is not that the creator missed an imaginary 50% threshold. The mistake is that the first eight seconds spend attention before answering the reason the viewer clicked. The comparison line has done its job: it has highlighted a moment worth inspecting. It has not explained the cause by itself.
| Illustrative timestamp | Current curve | Typical line | Read and action |
|---|---|---|---|
| 0:00 | 100% | 100% | Illustrative starting point; no diagnosis yet |
| 0:08 | 68% | 77% | Illustrative early separation; inspect the hook |
| 0:30 | 54% | 65% | Illustrative sustained gap; cut setup and reveal the payoff |
| 2:00 | 43% | 48% | Illustrative middle gap; check whether the opening promise was paid off |
The numbers above are illustrative so you can practise the read. They are not published YouTube benchmarks, and they do not predict what your next upload will show. In your own Studio view, hover the actual curve and write down the timestamp, not just the percentage.
Worked example 2: the fix
Now keep the topic and audience, but rewrite the opening around the promised outcome. The creator starts with the finished result, names the exact Studio panel, and moves the explanation after the first useful action. The same illustrative comparison might show the current curve above typical through the first 30 seconds, then a separation below it at 1:40.
That pattern changes the question. The opening is no longer the first suspect. The middle is. Look at the sentence or edit arriving just before 1:40: is it a detour, a repeated definition, an example that arrives too late, or a visual that stopped changing? Rewrite that single beat for the next upload instead of rebuilding the entire video around a line.
Use the comparison in sequence:
- Name the timestamp where the curves separate.
- Match that timestamp to the transcript, cut, visual, or promise.
- Describe the viewer job at that moment: learn, decide, verify, or keep watching.
- Remove or move the beat that makes that job harder.
- Keep the rest of the upload stable enough to learn from the change.

How to check this in YouTube Studio (step by step)
Start on a desktop browser if you need the fullest view of the report. Open YouTube Studio and select Analytics from the left menu. Select Content from the top menu, then move into the Videos area and open the audience-retention report for the upload you are reviewing.
Hover the curve where the relationship changes. Record three things: the timestamp, the direction of the gap, and what the viewer sees or hears at that instant. If the curve is below typical, inspect the last promise before the drop. If it is above typical, note what the video is doing that you may want to repeat.
Then classify the read. Above typical means look for a repeatable strength. Glued to typical means use a small, controlled experiment. Below typical means open the transcript or edit and find a friction point. The classification keeps you from rewriting every line.
Use this definition as a guardrail: typical retention is a comparison view, not a formula you can reproduce from public percentages. YouTube's wording describes the 10 latest videos of similar length; it does not publish a universal score for your niche.

If you want a second pair of eyes on the graph, use the related retention graph guide after you have written your timestamp and first hypothesis. For an opening-specific review, read the first-30-seconds guide as well. Use both guides to sharpen the diagnosis, not to replace the actual curve in Studio.
The trap
The better move is smaller. Use the comparison to choose one moment, then make one material change that addresses the likely cause. A delayed payoff needs a faster payoff; a confusing promise needs a clearer first sentence; a sagging middle needs a reason to continue before the next section begins.
The other trap is colour-only reading. A green or red visual can help your eye, but the meaning must come from the words and the timestamp. Say “below typical at 0:08” or “above typical through the opening,” not simply “red means bad.”
The trap
The move
You can also run the script through the viewer retention checker before recording. Treat it as a pre-production prompt for pacing and structure; the post-upload comparison in Studio is still the place where you inspect what happened on the actual video.

What to do in the next upload
Use this checklist while the next script is still editable:
- Write the opening promise in one sentence.
- Put the first useful action before the long setup.
- Mark the planned first payoff with a timestamp.
- Match the comparison to videos of similar length.
- Check the first obvious separation in the current curve.
- Name the likely cause before changing the script.
- Rewrite one beat, not the entire upload.
- Record what stayed constant for the next comparison.
- Recheck the next graph and update the hypothesis.
Manual review works without a RetentionYT account. If you want to shorten the loop, RetentionYT can sit beside your manual process, but do not let a tool replace the graph read. Open the chart, write the question, make the smallest useful change, and let the next upload answer it.
Frequently asked questions
- What does typical retention mean in YouTube Studio?
- Typical retention is YouTube's comparison line for your 10 latest videos of similar length. It gives you context for how a moment in the current video compares with a relevant set of your own uploads. Read it beside the current video's shape and timestamp, then use the difference to choose what to inspect or rewrite next.
- How is the comparison line calculated?
- YouTube describes typical retention as a comparison with your 10 latest videos of similar length. The Help wording does not give you a public equation or a universal percentage table. Treat the line as a product comparison view, not a score you can reproduce from an internet benchmark or a fixed formula.
- Should I beat typical at every second?
- No. A comparison line is useful for locating a meaningful separation, not for demanding that every second stay above it. Look for a sustained dip, a sharp early drop, or a middle section that falls away. Then inspect what you promised, showed, or delayed at that moment before choosing one rewrite.
- Why is typical low in my niche?
- The line is not a public niche benchmark, and the locked YouTube Help wording describes it as a comparison with your 10 latest videos of similar length. If it looks low, first check whether the comparison set fits the current format and length. Do not replace the graph with a universal niche table that YouTube did not publish.
- Does length change typical?
- Yes, length matters to the comparison described by YouTube: typical retention compares your 10 latest videos of similar length. That is why a four-minute upload should not be judged against a much longer essay using a generic table. Match the comparison set first, then read the shape at the timestamp where viewers separate.
- How do I apply “How to Use YouTube's Typical Retention Comparison Line” on my next upload?
- Before publishing, write down the promise of the opening and the moment where the first payoff should arrive. After the upload has enough data to inspect, compare the graph with the typical line, name one separation, and rewrite that beat for the next video. Keep the experiment narrow so you can tell what changed.
- Where in YouTube Studio do I check “How to Use YouTube's Typical Retention Comparison Line”?
- On desktop, open YouTube Studio and select Analytics from the left menu, then choose Content from the top menu. In the Videos area, look for Key moments for audience retention and the typical-retention comparison. You can use the expanded analytics report when you need a closer view of a specific moment.
- What is the most common mistake with “How to Use YouTube's Typical Retention Comparison Line”?
- The common mistake is treating the comparison line as a pass-or-fail score. A line above yours does not tell you the cause, and a line below yours does not prove the video is strong everywhere. Use the timestamp and the shape to form a question, then inspect the corresponding script, edit, or promise.
Give your next script a second look
Paste a script into RetentionYT for suggestions on your hook, pacing, and structure. Choose the edits that serve your video, then check audience behavior in YouTube Analytics after publishing.
Get retention tips in your inbox
Occasional, practical emails on hooks, pacing, and retention. No spam.
Related posts
Why Your Public View Count Changed and Your Retention Graph Did Not
YouTube views up retention same 2026? Separate the new public first-frame counter from engaged-view retention, then fix the opening that still loses viewers.
How to Read New vs Returning Overlays (When Studio Gives Them)
Use YouTube analytics new vs returning viewers overlay data to separate packaging problems from series fatigue, then choose the right rewrite or proxy.
The Rehook at 25%, 50% and 75%
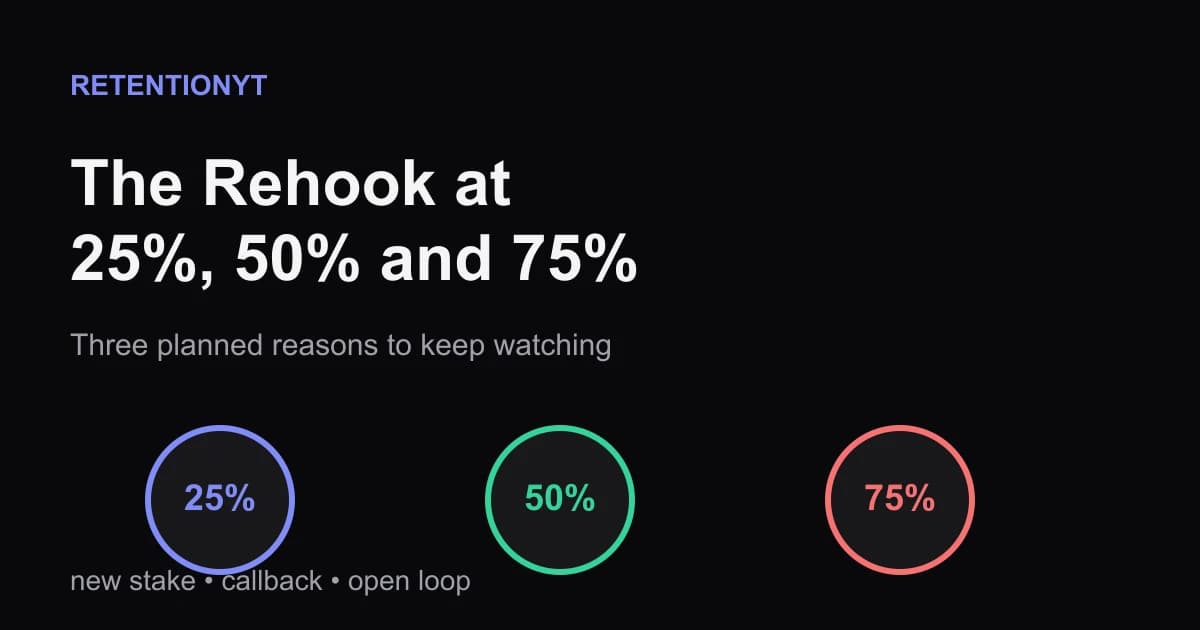
Schedule YouTube rehooks at 25%, 50% and 75% with three repeatable moves: a new stake, a callback, or an open loop that keeps the middle moving.