Why Your Public View Count Changed and Your Retention Graph Did Not
YouTube views up retention same 2026? Separate the new public first-frame counter from engaged-view retention, then fix the opening that still loses viewers.

9 min readUpdated
In this guide
If your views jumped and the retention curve did not, you did not suddenly get better at hooks. You got a new public counter. Open the Engagement view, not the vanity number, and check the first eight seconds for the cliff that still costs you viewers.

What “Why Your Public View Count Changed and Your Retention Graph Did Not” actually is (and what it is not)
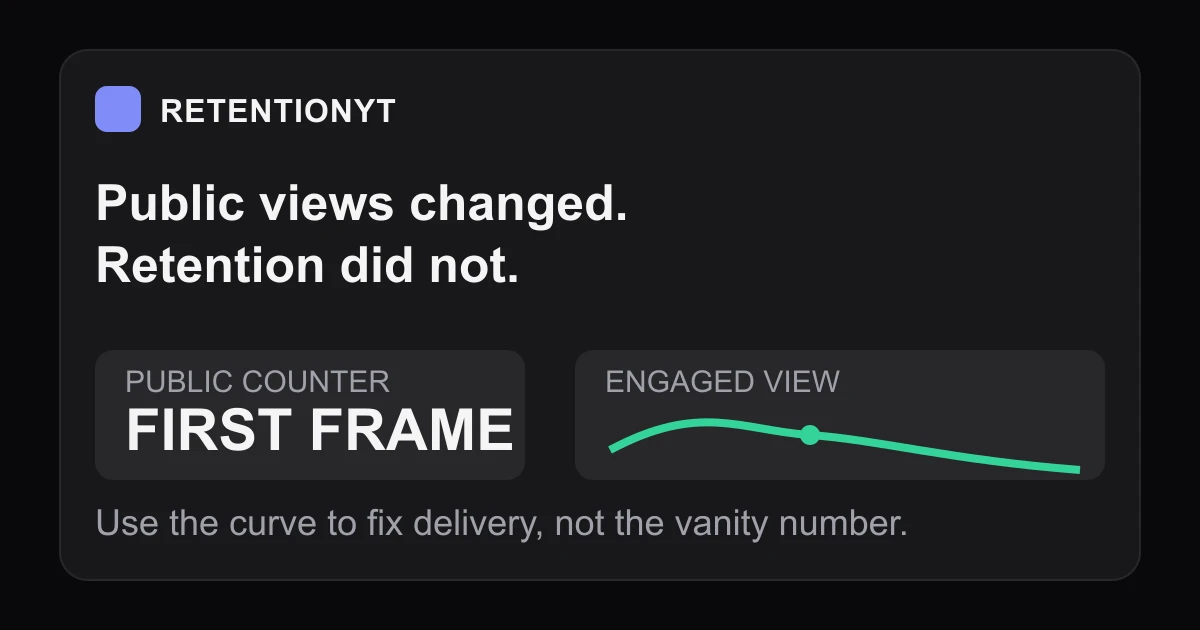
The short version is a measurement split. On August 24, 2026, YouTube began counting views when playback starts from the first frame across Shorts, long-form videos, and live streams. That changes the public counter you see around a video. It does not turn the counter into a retention score.
An engaged view is the deeper signal: the viewer stayed beyond the first frame and initial seconds. YouTube says engaged views remain useful for historical comparisons, and the vast majority of analytics remain anchored on them. That is why a larger public number can sit beside the same retention curve without contradiction.
| Signal | What it helps you ask | What it cannot prove by itself |
|---|---|---|
| Public view count | Did playback start from the first frame? | That the opening held attention |
| Engaged-view retention | Where did delivery lose viewers? | Why each viewer left |
| CTR and average view duration | How did the broader performance signals move? | That one public-count jump fixed the script |
The practical rule is simple: use the public count to notice exposure, then use the retention curve to choose an edit. The numbers in the Stats block are navigation aids and an illustrative 0:08 check, not YouTube benchmarks.
Why this shows up in YouTube Studio
The public count and the curve appear close enough to invite a bad conclusion. You see a bigger number on the watch page, open Analytics, and expect the line to rise with it. That expectation is the trap: one counter changed its start condition, while the delivery signal still tells you what happened after the opening began.
YouTube’s Creator Insider update says there is no change to CTR, average view duration, audience retention, or recommendations. It also says engaged views remain the metric used for monetization and revenue calculation, and that YPP eligibility continues to use qualified views. Source 1 is the primary explanation; SOURCE 1 is the locked video for the wording and timing.
The locked YouTube Help page makes the same boundary explicit: views now count when a video starts to play, but YPP earnings still use engaged views and engaged watch hours, while eligibility still uses qualified views. It also warns that Realtime activity is an estimate and may not match the watch-page number. Read SOURCE 2 when you need the platform’s written version.

Worked example 1: the failure
Illustrative example: a creator opens a new upload and sees the public count above the previous day’s number. The creator calls it a hook win, leaves the opening unchanged, and moves on. In the curve, the early cliff is still in the same place because the first-frame counter did not repair the delivery problem.
The failure has two parts. First, the creator uses exposure as a verdict on the script. Second, the creator never maps the cliff back to a sentence, visual, or promise. The right response is not to distrust the new public count; it is to stop asking it to answer a retention question.
| Illustrative check | Before the change | After the change | Interpretation |
|---|---|---|---|
| Public view count | 8,000 | 10,000 | Exposure counter moved |
| Retention at 0:08 | 62% | 62% | Delivery signal stayed flat |
| First cliff | 0:08 | 0:08 | Same opening problem |
| Next action | None | None | Failure: no test was created |
Those values are illustrative teaching numbers, not data from YouTube or a published benchmark. The diagnostic sentence is: “The public counter moved, but the first delivery failure did not.” That sentence keeps the work honest and gives you a specific place to edit.
Worked example 2: the fix
Illustrative example: the same creator separates the two panels. The public counter is recorded as an exposure note. The retention curve is opened next, and the creator marks the first cliff at 0:08. The script line at that timestamp delays the payoff, so the next draft states the result first and removes the setup that is not doing work.
The fix is deliberately small. It does not promise a particular percentage, and it does not claim that one rewrite guarantees performance. It changes the sentence that lines up with the cliff, preserves the title’s promise, and creates a test for the next upload. If the curve improves, you have a useful signal. If it does not, you have a cleaner next question.
Use the viewer retention checker only as a shortcut for organizing the review. The manual method still works without signing up: open the curve, mark the moment, read the matching script, and change one cause at a time.

How to check this in YouTube Studio (step by step)
Use this as a rule-of-thumb route because interface labels can change. Start at YouTube Studio and choose the upload you are reviewing. Record the public watch-page count without treating it as a verdict, then open the video’s Analytics area and select the Engagement view that shows the retention curve.
First, mark the earliest meaningful cliff rather than chasing every small wiggle. An illustrative 0:08 marker is useful because it forces a timestamped review, but your own curve may point to 0:05, 0:12, or another moment. The timestamp must come from the curve you are looking at, not from a benchmark copied from another creator.
Second, open the script or edit decision list beside that timestamp. Read the sentence that is spoken, the visual that is shown, and the promise implied by the title and thumbnail. Ask one concrete question: did the viewer receive the reason they clicked before the opening asked them to wait?
Third, classify the problem as packaging or delivery. Packaging is the promise a viewer sees before playback; delivery is how the video pays that promise off once playback starts. A public-count change belongs to the first-frame exposure side. The retention curve is where you inspect delivery.
Fourth, choose one fix. Cut the throat-clearing, move the payoff earlier, replace a vague first sentence with the specific result, or change the visual that makes the opening feel like a preamble. Those are editing choices, not platform guarantees. Keep the change narrow enough that the next curve can teach you something.
Fifth, write the test in one line: “I moved the payoff before the setup and will compare the first cliff on the next upload.” Do not predict a percentage. Compare the shape, timestamp, and the promise-to-delivery match after the next result has enough data to inspect.

The trap
The trap is celebrating the public counter and ignoring the unchanged curve. It feels efficient because one visible number moved. It is expensive because the next upload repeats the same opening, so you learn nothing about the sentence or visual that lost the viewer.
A second trap is treating “engaged view” as a universal fixed-second threshold. YouTube says the exact number of seconds can vary across surfaces. Do not publish a made-up threshold, and do not turn an illustrative marker into a platform rule.
The trap
The move

What to do in the next upload
Make the next upload a controlled comparison, not a reaction to a public counter. Keep your title promise clear, tighten the first seconds, and decide in advance which curve shape would tell you the opening improved. You are not trying to manufacture a perfect line; you are trying to make one decision that the next graph can confirm or reject.
If you want the longer graph-reading workflow, read How to Read Your YouTube Retention Graph. For the opening-specific pass, use The First 30 Seconds. If you want a private place to organize drafts, RetentionYT can shorten the manual review, but you do not need an account to use the method above.
- Record the public view count separately from the retention curve.
- Open the Engagement view for the upload you are reviewing.
- Mark the first meaningful cliff with a timestamp.
- Read the matching script line and on-screen visual.
- Check whether the opening delivers the title promise early.
- Label illustrative numbers as illustrative, never as benchmarks.
- Choose one change for the next upload.
- Compare the next curve before declaring a win.
A bigger public number is a new exposure clue, not a rewrite of what happened after the first frame.
The clean habit is to keep the panels separate every time: public views tell you that playback started, while engaged-view retention tells you where delivery needs work. When the curve stays flat, believe the curve, find the first cliff, and edit the seconds that created it.
Frequently asked questions
- Why did my YouTube views go up overnight?
- Your public view count can rise because YouTube now counts a view when playback starts from the first frame across formats. That number measures exposure, not whether the viewer stayed. Compare the public counter with engaged-view retention before deciding that your hook or delivery improved.
- Why is retention unchanged?
- Retention can stay unchanged because the retention curve is still an engaged-view signal. YouTube says the public-count change does not change retention, CTR, average view duration, or recommendations. If the curve still drops at the same second, the same opening problem is still present.
- Should I celebrate the new view count?
- You can note the increase, but do not treat it as proof that the video held attention better. First-frame public views and engaged-view retention answer different questions. Celebrate the exposure change only after you also check the curve, the first cliff, and the promise your opening delivers.
- What number does the algorithm use?
- Do not reduce YouTube’s systems to one public number. For this change, YouTube says the vast majority of analytics remain anchored on engaged views, with no change to CTR, average view duration, retention, or recommendations. YPP earnings use engaged views and engaged watch hours, while eligibility uses qualified views.
- Where are engaged views in Studio?
- Open the video in YouTube Studio, go to its Analytics area, and use the Engagement view to inspect the retention curve. Interface labels can vary, so use the metric name rather than hunting for the public counter. You can also compare the watch-page count with Analytics, which YouTube says may differ during estimation.
- How do I apply “Why Your Public View Count Changed and Your Retention Graph Did Not” on my next upload?
- Write down the public count separately, then study the engaged-view curve. Mark the first meaningful cliff, find the matching line in your script, and rewrite only that moment for the next upload. Keep the title promise visible while you tighten the first eight seconds and re-check the new curve.
- Where in YouTube Studio do I check “Why Your Public View Count Changed and Your Retention Graph Did Not”?
- Use the uploaded video’s Analytics and Engagement areas in YouTube Studio. The article is a way to interpret the two signals, not a separate Studio report. Check the public watch-page count, then check the retention curve and its early shape. Interface paths can change, so confirm the labels on your screen.
- What is the most common mistake with “Why Your Public View Count Changed and Your Retention Graph Did Not”?
- The common mistake is treating a public-count increase as a retention win. That collapses exposure and delivery into one score. Keep the counters separate: record the first-frame public number, inspect engaged-view retention, identify the first cliff, and change the opening rather than congratulating the counter.
Give your next script a second look
Paste a script into RetentionYT for suggestions on your hook, pacing, and structure. Choose the edits that serve your video, then check audience behavior in YouTube Analytics after publishing.
Get retention tips in your inbox
Occasional, practical emails on hooks, pacing, and retention. No spam.
Related posts
How to Read New vs Returning Overlays (When Studio Gives Them)
Use YouTube analytics new vs returning viewers overlay data to separate packaging problems from series fatigue, then choose the right rewrite or proxy.
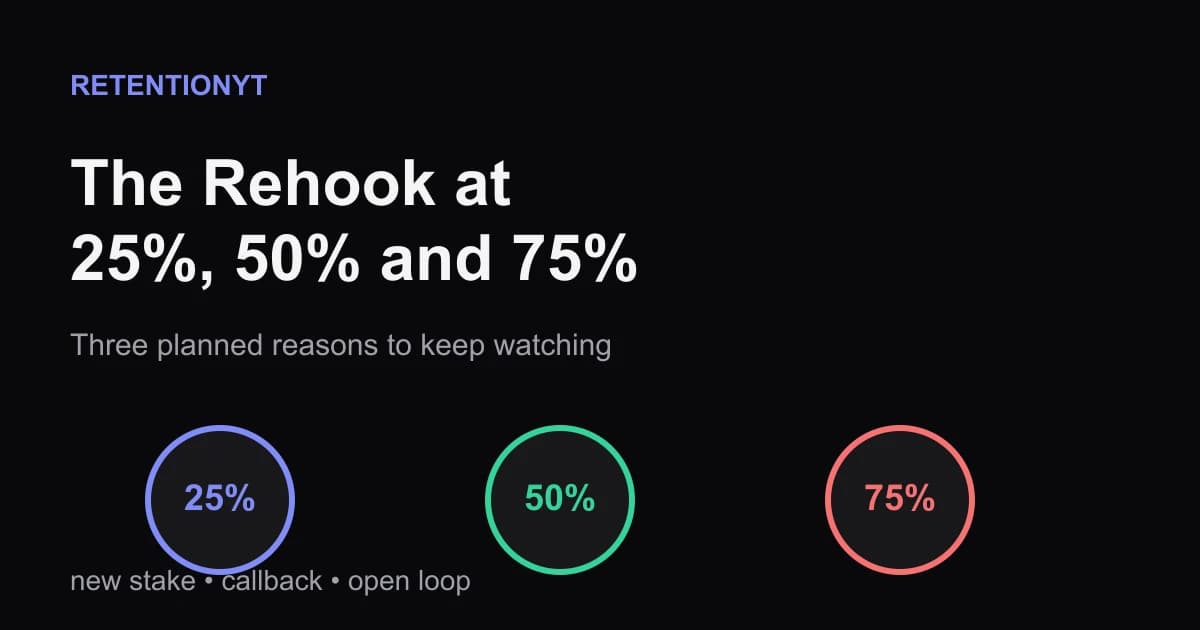
The Rehook at 25%, 50% and 75%
Schedule YouTube rehooks at 25%, 50% and 75% with three repeatable moves: a new stake, a callback, or an open loop that keeps the middle moving.
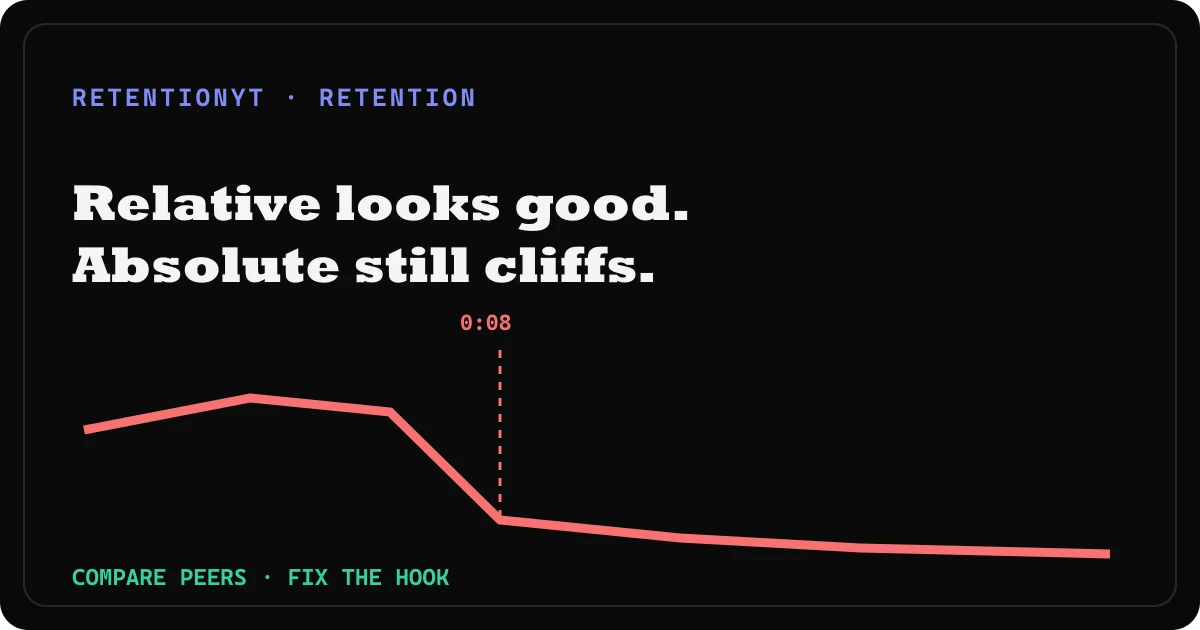
Relative Retention High, Absolute Cliff: What It Actually Means
Relative retention good but absolute retention bad? Read the comparison as context, find the 0:08 cliff, and rewrite the opening that caused it.