How to Read New vs Returning Overlays (When Studio Gives Them)
Use YouTube analytics new vs returning viewers overlay data to separate packaging problems from series fatigue, then choose the right rewrite or proxy.

9 min readUpdated
In this guide
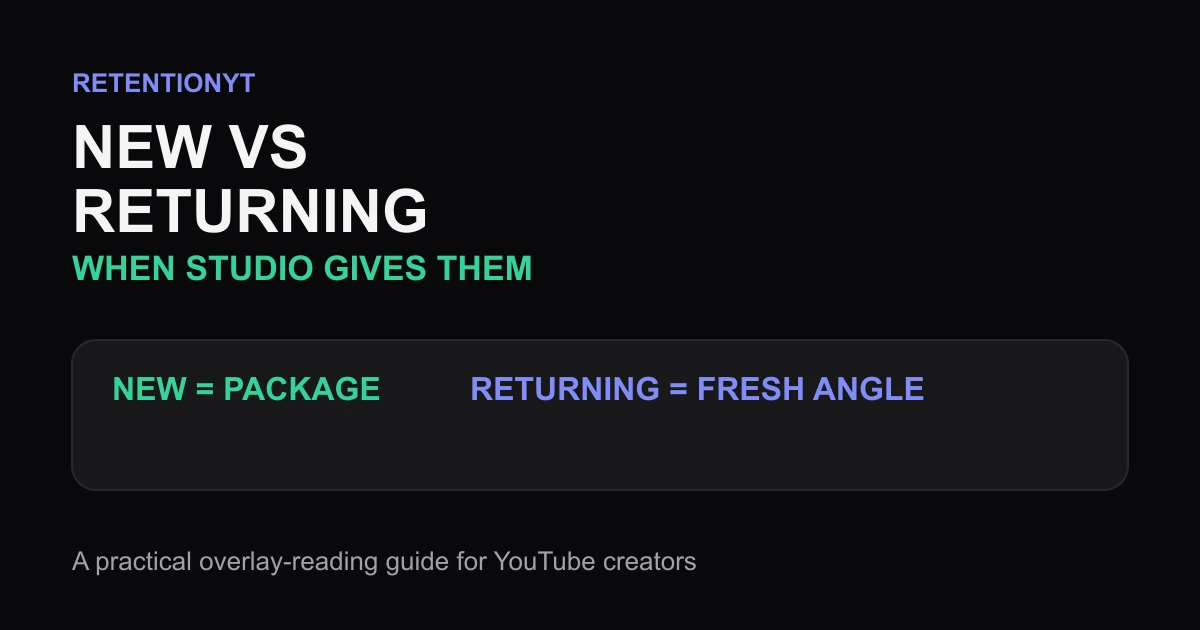
If Studio gives you a new-versus-returning split, treat it as two rewrite jobs, not a magic score. A new-viewer cliff points you toward packaging and promise; a returning-viewer slump asks whether this episode feels too familiar. If the overlay is missing, use unique viewers plus subscriber percentage as a clearly labelled proxy, and write down the limitation before you act.

What How to Read New vs Returning Overlays (When Studio Gives Them) actually is (and what it is not)
The overlay is a comparison lens. One line represents new viewers; the other represents people who have encountered your work. Ask not “which line is higher?” but “what did each viewer expect, and where did that expectation break?”
That distinction changes the rewrite. If new viewers fall while returning viewers hold, inspect the title, thumbnail, opening sentence, and first visual. If returning viewers fall, inspect repetition or an episode that delays its new reason to exist.
These are editorial interpretations, not a promise that every account shows this overlay. Source 1 currently describes Reach reports, not this overlay. Source 2 describes the channel-level Content tab, but does not name a permanent new-versus-returning control (August 2026; SOURCE 1 SOURCE 2).
| Viewer line | Working question | First rewrite to test | What not to claim |
|---|---|---|---|
| New viewers | Did the package confirm the video’s value fast enough? | Clarify the promise and show the result earlier | A line alone proves thumbnail failure |
| Returning viewers | Did this episode earn attention beyond the familiar format? | Change the angle, stakes, or example | A slump alone proves audience fatigue |
| Overlay missing | What evidence can you compare consistently? | Use unique viewers plus subscriber % as a proxy | The proxy is not the hidden overlay |
Keep the comparison stable: use the same upload type, date range, and notes. Subscriber percentage is not a hidden audience label; it is a directional signal for what to inspect next.
These values are editorial operating targets, not YouTube benchmarks. The 8-second check is a practical review window; it does not mean every audience decides at exactly 8 seconds.
Why this shows up in YouTube Studio
Studio is where you inspect the evidence around the audience you are trying to reach. Source 1 says the Reach tab helps you understand how viewers find your content and documents a path through YouTube Studio, Content, the selected video, Analytics, and Reach. It also describes traffic from external sites or apps, which matters when a package brings a new viewer from outside YouTube (August 2026; SOURCE 1).
Source 2 says the Content tab gives an overview of how your audience finds content, what it watches, and how it interacts with content. It says the Content tab is available at the channel level and documents the path through YouTube Studio, Analytics, and Content. It also lists unique viewers, average view duration, average percentage viewed, and watch time as metrics to know (August 2026; SOURCE 2).
The locked Source 1 URL does not currently contain the brief’s requested overlay instructions. That is why this article focuses on the job of the split and gives you a fallback when the UI hides it. Do not write “YouTube removed the feature” unless you have a current, account-specific source that says so.

When you open a report, capture the date range and report name. If unavailable, capture unique viewers and subscriber percentage, and note the limitation.
Worked example 1: the failure
This is an illustrative example, not YouTube data. A creator publishes a five-video series about editing tutorials. The title and thumbnail promise a fast before-and-after, but the first 0:30 repeats the channel intro and recaps the previous episode. New viewers leave early; returning viewers also soften because they have already heard the setup.
The creator treats both problems as one failure and changes the entire series. The better diagnosis separates acquisition from familiarity: new viewers need the promise confirmed, while returning viewers need a fresh payoff.
| Illustrative segment | New viewers | Returning viewers | Diagnosis |
|---|---|---|---|
| 0:00–0:08 | 62% | 86% | New viewers need the promised result sooner |
| 0:08–0:30 | 48% | 71% | Repeated intro taxes both groups |
| 0:30–1:20 | 44% | 52% | Episode has not earned a fresh angle |
| 1:20–2:00 | 39% | 45% | Illustrative downstream loss, not a benchmark |
Every number in this table is illustrative. The failure is not that one audience is “bad”; it is that the opening asks both audiences to wait for proof. The creator needs a packaging repair for new viewers and an originality repair for returning viewers.
Worked example 2: the fix
Keep the topic, but open on the finished before-and-after at 0:03. Say what changed, show the one setting that caused the result, and then add a new constraint that returning viewers have not seen: the same edit must remain readable on a phone-sized preview.
The fix serves both groups without pretending they are identical: new viewers get package confirmation, while returning viewers get a fresh problem. Keep the test narrow.

Do not promise that the fix will raise a particular percentage. The point is to make the next upload diagnostic: show the result earlier, add one fresh constraint, and compare the same proxy or split after publishing.
How to check this in YouTube Studio (step by step)
You are checking a hypothesis, not hunting for a magic overlay. Open YouTube Studio, start with the report your account exposes, record what is visible, and keep labels consistent from one upload to the next.
-
Name the upload and window. Write the video title, upload date, selected date range, and report name before reading any line.
-
Look for the split without guessing. If new and returning viewers are shown, capture the labels and the two curve shapes. If they are not shown, write “overlay unavailable” rather than filling in a missing value.
-
Build the proxy. Record unique viewers and subscriber percentage for the same window. Label them as a proxy and keep the comparison method unchanged.
-
Mark the first meaningful drop. Note the timestamp, spoken sentence, visual, and viewer expectation immediately before the drop. A curve is a clue; the footage supplies the cause.
-
Choose the audience-specific rewrite. For new viewers, test the title-to-opening promise. For returning viewers, test a new angle, constraint, example, or payoff.
-
Change one variable. Keep the topic and most of the edit stable enough that your next comparison can teach you something.

Source 2 documents the channel-level Content path through Studio; Source 1 documents the Reach path. Use the available report rather than inventing a route (August 2026; SOURCE 2 SOURCE 1). For a second opinion on script risk, use the related tool. Read related post 1 for graph-reading context and related post 2 for opening-window ideas.
The trap
The trap is treating “new” and “returning” as permanent personality types. A returning viewer can arrive through a new package; a new viewer can behave like a loyal fan after one strong video. The labels are comparison clues, not verdicts.
The trap
The move

A segment is a question to test, not a verdict about your audience.
Use the split to narrow the edit, not to declare a channel dead. If you cannot see it, use the proxy workflow.
What to do in the next upload
Write the two hypotheses before you record. After publishing, use the same report or proxy window, then make one audience-specific change. RetentionYT can shorten the pre-publication review, but the manual method works without signing up.
Where RetentionYT fits
Manual method works alone. Product shortens the loop. Use RetentionYT when you want a script review before recording; keep the split-or-proxy check usable without signing up.
- Record the video title, upload date, and selected date range.
- Write down whether the new-versus-returning overlay is visible.
- Capture both curve labels if Studio provides them.
- If it is missing, record unique viewers and subscriber percentage.
- Label proxy values as proxy values in your notes.
- Mark the first meaningful drop and the sentence spoken there.
- Check the title, thumbnail, and first 8 seconds for new viewers.
- Check repetition, angle, and payoff for returning viewers.
- Change one variable on the next upload.
- Compare the same window and report type after publishing.
The useful output is a smaller decision: clarify the promise, refresh the episode, or collect a cleaner proxy. Write it beside the timestamp, then make the next upload answer it.
References
Frequently asked questions
- Where is new vs returning in YouTube Studio?
- If your account exposes a new-versus-returning overlay, look for it inside the audience or viewer breakdown attached to the report you are reviewing. The locked Help pages do not verify one permanent button or path for this split. Start from the report available to your account, then record the selected upload, date range, and audience segment.
- What if I cannot find the overlay?
- Do not invent a missing control. Use unique viewers and subscriber percentage as a working proxy, write that limitation in your notes, and compare the same date range across uploads. You can still diagnose whether the problem looks like weak packaging or a tired series; just label the conclusion as a proxy read rather than an official overlay result.
- How do I act on it?
- Treat a new-viewer cliff as a promise or packaging question: check the title, thumbnail, and first 8 seconds together. Treat a returning-viewer slump as a series question: change the angle, raise the stakes, or remove repeated setup. These are editorial diagnostic rules, not a claim that YouTube assigns a fixed cause to every curve.
- Is subscriber % a proxy?
- Yes, as a practical proxy when the split is unavailable, not as a replacement metric. Pair subscriber percentage with unique viewers, the upload’s date range, and your own notes about the audience. A proxy cannot prove who saw a specific overlay line; it can help you decide which rewrite to test next.
- Did YouTube remove this?
- You cannot answer that from a missing control alone. Studio reports and labels move, and the locked Source 1 URL currently opens to a Reach page rather than a new-versus-returning overlay guide. Check the report your account provides, document the date, and use the proxy workflow instead of claiming a removal.
- How do I apply “How to Read New vs Returning Overlays (When Studio Gives Them)” on my next upload?
- Before publishing, write two hypotheses: new viewers may need a clearer promise, while returning viewers may need a fresher reason to continue. After the upload, record the available split or proxy values, mark the first meaningful drop, and make one rewrite for the larger risk. Keep the numbers labelled as your observation, not a platform benchmark.
- Where in YouTube Studio do I check “How to Read New vs Returning Overlays (When Studio Gives Them)”?
- There is no verified Studio metric with this article title. Source 2 documents a channel-level Content path through YouTube Studio, Analytics, and Content, while Source 1 documents a Reach path. Use whichever report your account exposes, and treat this article’s overlay labels as a diagnostic framework rather than a promised menu item.
- What is the most common mistake with “How to Read New vs Returning Overlays (When Studio Gives Them)”?
- The common mistake is applying one fix to both audiences. A new-viewer problem often asks for clearer packaging and a faster promise; a returning-viewer problem may ask for a different angle or less repeated setup. Compare the segments first, then test one change instead of rewriting the whole channel from one line.
Give your next script a second look
Paste a script into RetentionYT for suggestions on your hook, pacing, and structure. Choose the edits that serve your video, then check audience behavior in YouTube Analytics after publishing.
Get retention tips in your inbox
Occasional, practical emails on hooks, pacing, and retention. No spam.
Related posts
The Rehook at 25%, 50% and 75%
Schedule YouTube rehooks at 25%, 50% and 75% with three repeatable moves: a new stake, a callback, or an open loop that keeps the middle moving.
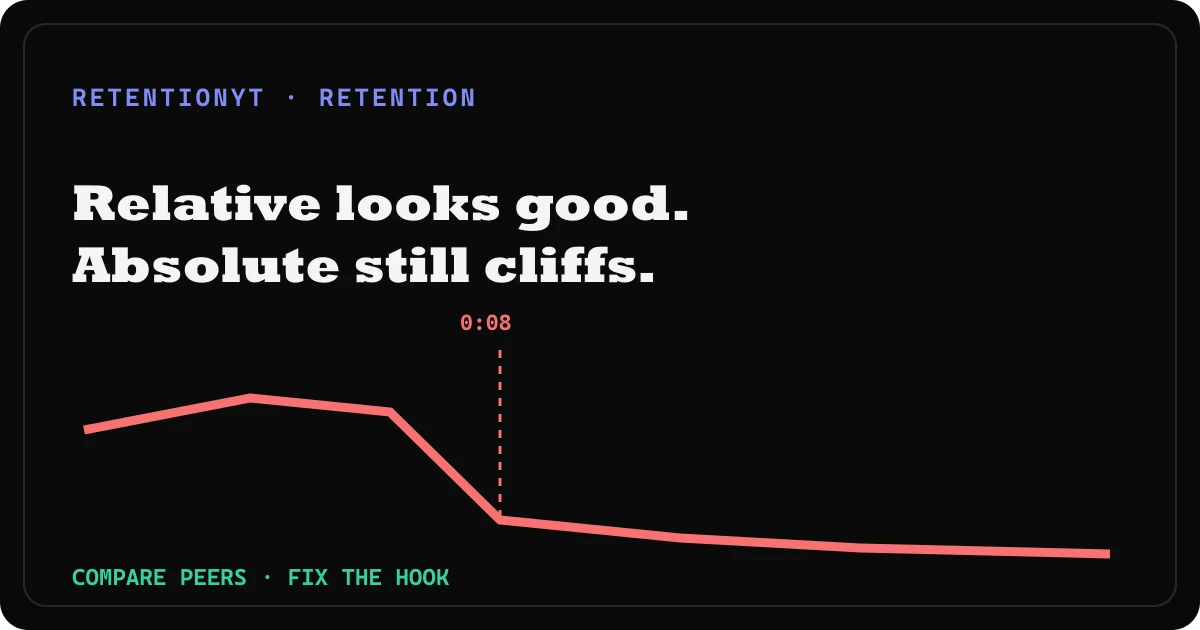
Relative Retention High, Absolute Cliff: What It Actually Means
Relative retention good but absolute retention bad? Read the comparison as context, find the 0:08 cliff, and rewrite the opening that caused it.
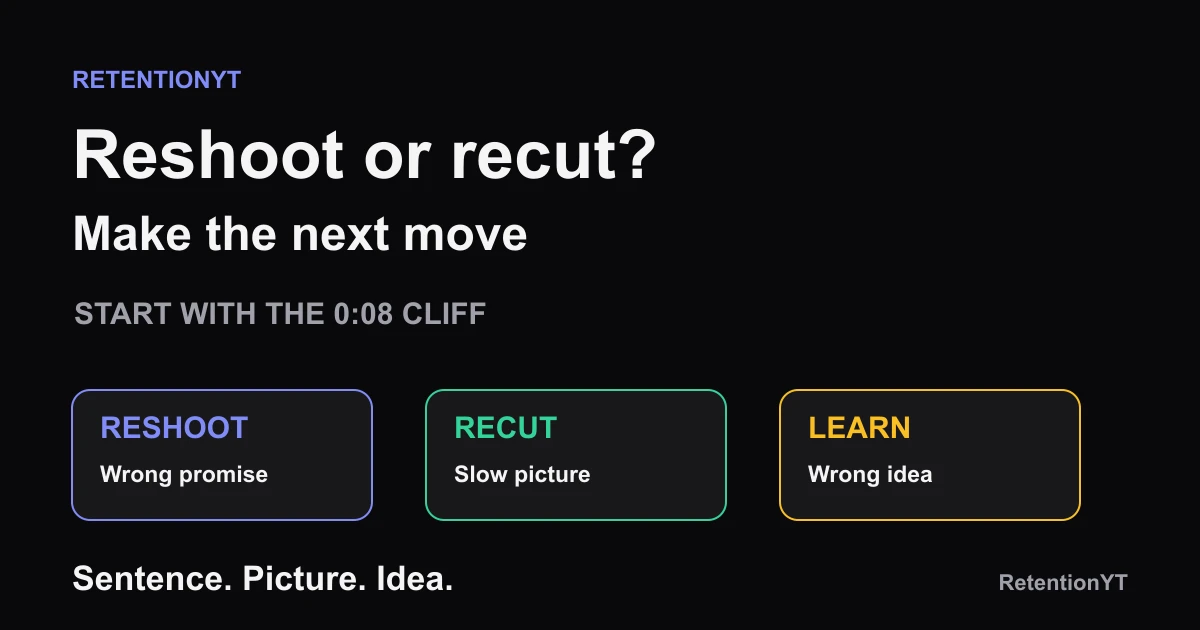
Reshoot the Intro vs Recut the B-roll: A Decision Rule
Should I reshoot YouTube intro or recut? Use the 0:08 cliff to decide whether the sentence, the picture, or the whole idea needs a different next move.