Relative Retention High, Absolute Cliff: What It Actually Means
Relative retention good but absolute retention bad? Read the comparison as context, find the 0:08 cliff, and rewrite the opening that caused it.

9 min readUpdated
In this guide
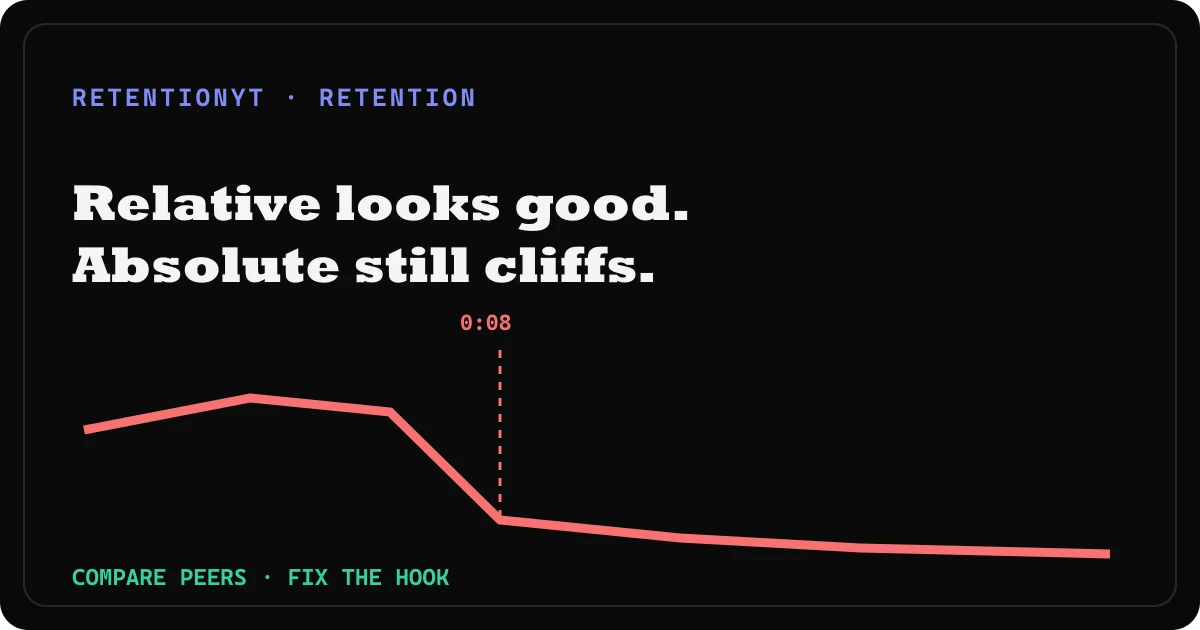
At 0:08, your curve can fall even when the relative comparison looks fine. That does not make the opening safe; it tells you to separate context from action. Mark the timestamp, read the line and visual at the cliff, then rewrite one opening beat before your next upload.

What Relative Retention High, Absolute Cliff actually is (and what it is not)
Think of two different questions. Relative retention is comparison context: how your result sits beside similar-length videos or a typical line. Absolute retention is the behaviour of your own upload across its timeline, such as the percentage watched at a moment or the shape of its curve. The practical rule is editorial: a comfortable comparison cannot erase a sharp opening drop.
The locked SOURCE 1 URL is a source conflict. On August 24, 2026, it opens YouTube Help’s “Understand your YouTube video reach,” not the supplied “Audience retention” page. It supports a Reach report and the computer path YouTube Studio → Content → selected video → Analytics → Reach, but it does not support the brief’s relative-retention or typical-line claims.1
Where RetentionYT fits
Manual method works alone. Product shortens the loop. RetentionYT can help you review script pacing before recording, but you can diagnose this without signing up.
The term typical retention matters because it is a comparison, not a guarantee. The exact SOURCE 2 page says typical retention can compare your 10 latest videos of similar length. That helps you ask whether the curve is unusual for your catalogue; it does not tell you to ignore the first cliff.
| Signal | Use it for | Do not turn it into |
|---|---|---|
| Relative / typical comparison | Peer or catalogue context | Proof that your hook works |
| Absolute curve | Your upload’s moment-by-moment review | A universal platform threshold |
| 0:08 marker | A timestamp to inspect | A guaranteed failure second |
| Transcript line | A concrete edit hypothesis | A verdict about your whole niche |
Why this shows up in YouTube Studio
In August 2026, the exact locked SOURCE 2 page is titled “Understand your YouTube content performance.” It says the Content tab is only available at the channel level and gives the computer path: sign in to YouTube Studio, select Analytics, then Content. Under Videos, Key moments for audience retention shows how well different moments held viewers’ attention, and typical retention can compare your 10 latest videos of similar length.2
The same source states that beginning August 24, 2026, views are counted when a video starts to play across Shorts, long-form videos, and live streams. That date matters for reading the current metric context, not for deciding whether your hook needs a rewrite.
Worked example 1: the failure
Here is an illustrative example, not a channel result and not YouTube data. A creator sees a relative comparison above the typical line and concludes the opening is fine. At 0:08, the absolute curve falls from an illustrative 100% starting point to 68%, immediately after a title-card sentence that delays the promised proof.
The mistake is not looking at two lines. The mistake is allowing the comparison to answer a different question: “How do I sit beside similar videos?” The editing question is “What did my viewer see and hear at 0:08, and what promise had not arrived?”
| Timestamp | Illustrative curve reading | What the viewer gets | Working diagnosis |
|---|---|---|---|
| 0:00 | 100% starting point | Promise is stated | Attention has a job |
| 0:08 | 68% illustrative point | Title card, no proof | Opening delay |
| 0:30 | 55% illustrative point | First useful example | Value arrives late |
| end | 31% illustrative endpoint | Full lesson completes | Comparison hid the start problem |

Do not fix this by chasing a new niche or deleting the comparison report. Keep the useful context, but rewrite the first proof so the promised value arrives before the viewer has to wait through the title card.
Worked example 2: the fix
The revised opening shows the result first, then names the method. The creator removes the delayed title card, says what changed in one sentence, and moves the context into a short line after the proof. The relative comparison remains a reference point; the absolute curve remains the edit evidence.
The example percentages are illustrative. The test is not whether 68% becomes a particular number; it is whether the first beat now answers the title and gives the viewer a reason to continue.
Use these six rewrite moves as a menu, not as six promises:
- Put the result before the explanation.
- Replace a greeting or title card with the first concrete claim.
- Show the proof frame before naming the framework.
- Cut a sentence that repeats the title instead of advancing it.
- Make the next payoff visible before the comparison context.
- Keep one opening hypothesis so the next upload teaches you something.
For a line-by-line graph workflow, read how to read your YouTube retention graph. For a tighter first window, read the first-30-seconds guide. The viewer retention checker can shorten a pre-recording review, while this manual method works without an account.

How to check this in YouTube Studio (step by step)
-
Write the two questions. Put “How do I compare?” beside “Where does my own curve fall?” Do not let one answer substitute for the other.
-
Open the documented report. SOURCE 2 gives the Computer path: sign in to YouTube Studio, select Analytics, then Content. Its Videos area includes Key moments for audience retention.
-
Record the comparison context. If typical retention is available, note that it compares your 10 latest videos of similar length. Treat the comparison as context, not a grade to celebrate.
-
Mark the absolute cliff. Write the exact mm:ss where your curve changes sharply. Use 0:08 only as an illustrative example, not a platform threshold.
-
Align the transcript. Copy the spoken sentence, visible frame, and promise at the marker. Name one hypothesis: delayed proof, unclear promise, repeated setup, or a weak first visual.
-
Rewrite one beat and log the test. Note the date, video length, old line, new line, and marker. Compare the next upload without claiming that one result proves a universal rule.
The locked SOURCE 1 URL can also be opened through the Reach path it actually documents: YouTube Studio → Content → selected video → Analytics → Reach. Do not call that page the audience-retention report; its current title and contents are different.

The trap
The trap is using “typical” as emotional relief. If your peers also have weak openings, the comparison may look ordinary while your viewers still leave early. That is an editorial interpretation, not a claim that YouTube declares a niche bad.
A second trap is changing five things at once. If you rewrite the hook, thumbnail, topic, runtime, and music together, the next curve cannot tell you which change mattered. Keep the experiment narrow: one opening beat, one timestamp, one dated note.
The trap
The move

A comparison can explain where you sit; only your curve tells you where to edit.
What to do in the next upload
Write the promise before the intro. When the relative comparison looks comfortable but the absolute curve cliffs, do not argue with the graph or declare the niche broken; read the line, change one beat, and make the next upload a controlled test.
- Record the comparison context and the exact report date.
- Separate the relative question from the absolute curve question.
- Mark the earliest meaningful cliff in mm:ss.
- Read the spoken line and visible frame at the marker.
- Identify the promised value that arrived late or unclearly.
- Rewrite one opening beat before changing the whole script.
- Move proof before repeated setup or a title card.
- Keep illustrative percentages labelled in prose and captions.
- Log the old line, new line, date, and video length.
- Compare the next upload without promising a universal lift.
Typical is useful when it keeps you from overreacting to one curve. It becomes harmful when it keeps you from editing an obvious opening problem. Use the comparison to orient yourself, then let the absolute curve choose the next sentence.
Frequently asked questions
- What if relative retention looks good but the curve still drops?
- Treat the comparison as context, not a clean bill of health. A favourable relative or typical comparison can coexist with an early fall in your own curve. Mark the timestamp, read the transcript and edit around it, then test a hook rewrite. The exact locked sources do not establish a universal “good” threshold, so keep the diagnosis upload-specific.
- Is typical a free pass?
- No. Typical retention is a comparison with other videos of similar length, not proof that your opening is working. Use it to understand context, then inspect your absolute curve for an early cliff. If viewers leave at 0:08 in your upload, rewrite the first beat even when the comparison line looks comfortable.
- Should I still rewrite the hook?
- Yes, if your absolute curve drops in the opening. A comparison line can tell you how a video relates to similar-length videos, but it cannot finish your diagnosis. Rewrite the promise, first proof, or first visual; document the change and compare the next upload rather than assuming one edit guarantees a lift.
- Can a whole niche have bad intros?
- A whole niche may share a weak convention, but the locked YouTube Help pages do not prove that every niche fails intros. Treat that idea as an editorial hypothesis. Your own curve still gives you a concrete test: identify the first cliff, locate its spoken line, and change that beat before your next upload.
- How do I beat typical?
- Beat typical by improving the part you control: your own curve and opening. Use the comparison report for context, mark the earliest meaningful fall, and rewrite one specific line or visual. Numbers in the article’s examples are illustrative, not benchmarks. Judge the next upload by the recorded edit and timestamp, not by a promise of a result.
- How do I apply “Relative Retention High, Absolute Cliff” on my next upload?
- Use the manual workflow: record the comparison context, mark the absolute cliff at its mm:ss, align it to the transcript, rewrite one opening beat, and note the date. RetentionYT can shorten pre-recording review, but this method works without signing up. Keep illustrative percentages labelled and do not invent a platform threshold.
- Where in YouTube Studio do I check “Relative Retention High, Absolute Cliff”?
- The exact SOURCE 1 URL currently opens a Reach report, not the supplied Audience retention page. The exact SOURCE 2 page documents YouTube Studio → Analytics → Content and says the Videos area includes Key moments for audience retention plus typical retention comparison for the 10 latest videos of similar length. Use the source that actually supports each sentence.
- What is the most common mistake with “Relative Retention High, Absolute Cliff”?
- The common mistake is treating “typical” as the diagnosis. It is comparison context, while the absolute curve shows what happened in your upload. Do not ignore an early cliff because peers have similar problems. Match the timestamp to the line, change one beat, and retest the next upload.
Give your next script a second look
Paste a script into RetentionYT for suggestions on your hook, pacing, and structure. Choose the edits that serve your video, then check audience behavior in YouTube Analytics after publishing.
Get retention tips in your inbox
Occasional, practical emails on hooks, pacing, and retention. No spam.
Related posts
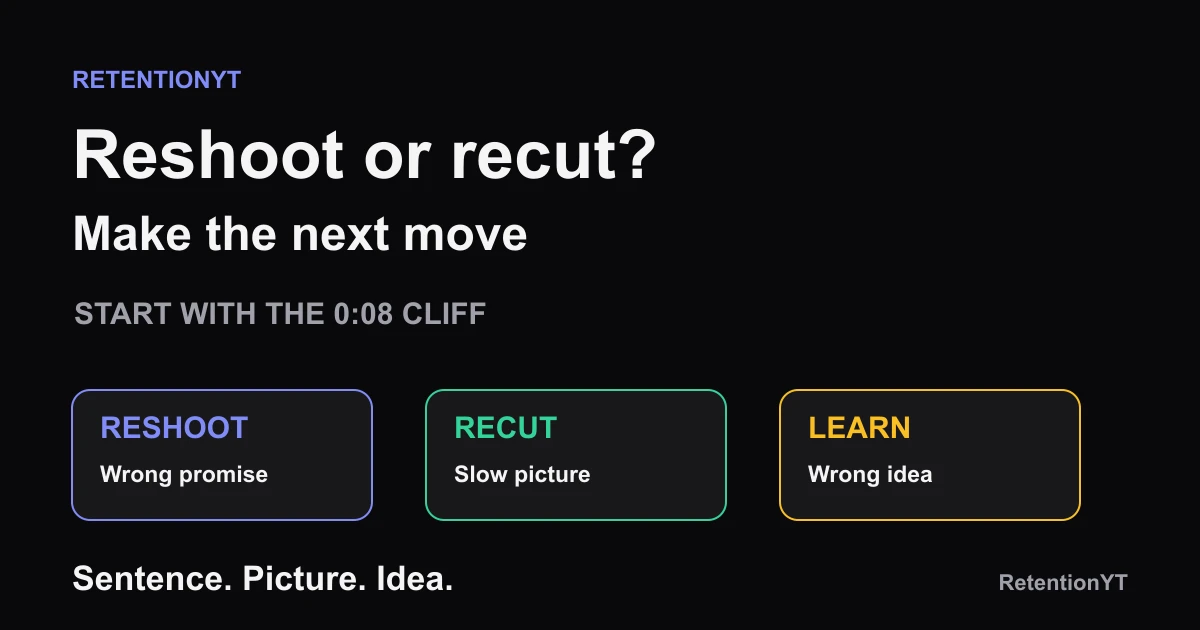
Reshoot the Intro vs Recut the B-roll: A Decision Rule
Should I reshoot YouTube intro or recut? Use the 0:08 cliff to decide whether the sentence, the picture, or the whole idea needs a different next move.
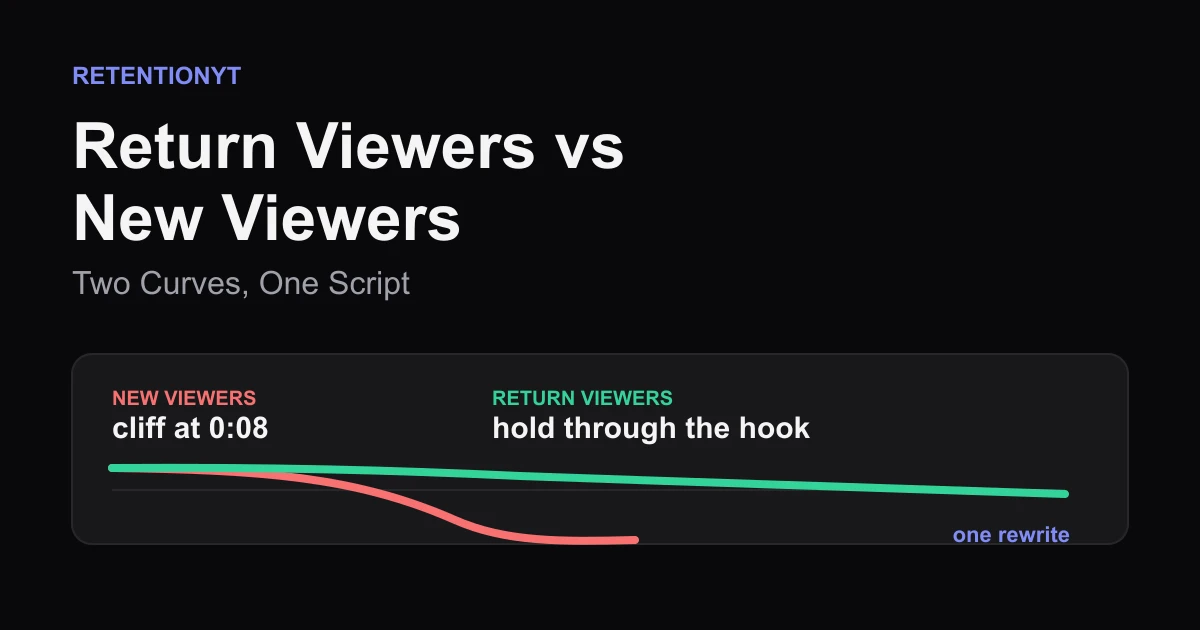
Return Viewers vs New Viewers: Two Curves, One Script
YouTube new vs returning viewers retention is a promise test: read the two curves, find the 0:08 cliff, and rewrite one opening that serves strangers without losing fans.
Search Traffic Is Patient, Suggested Is Not
Learn why YouTube search vs suggested retention can look different, how to split the curve in Studio, and how to rewrite the hook for the impatient source.