Unique Viewers vs Views in YouTube Studio 2026
Unique viewers vs views in YouTube Studio 2026: understand the new first-frame count, separate people from playbacks, and use retention to judge your next upload.

10 min readUpdated
In this guide
Views are playback events; unique viewers are an estimate of distinct people. Since August 24, 2026, a video can also earn a public view from the first frame when playback starts automatically. If views are 10,000 and unique viewers are 6,200, do not call the difference a failure: check engaged views and the retention curve before changing your hook.
What Unique Viewers vs Views in YouTube Studio 2026 actually is (and what it is not)
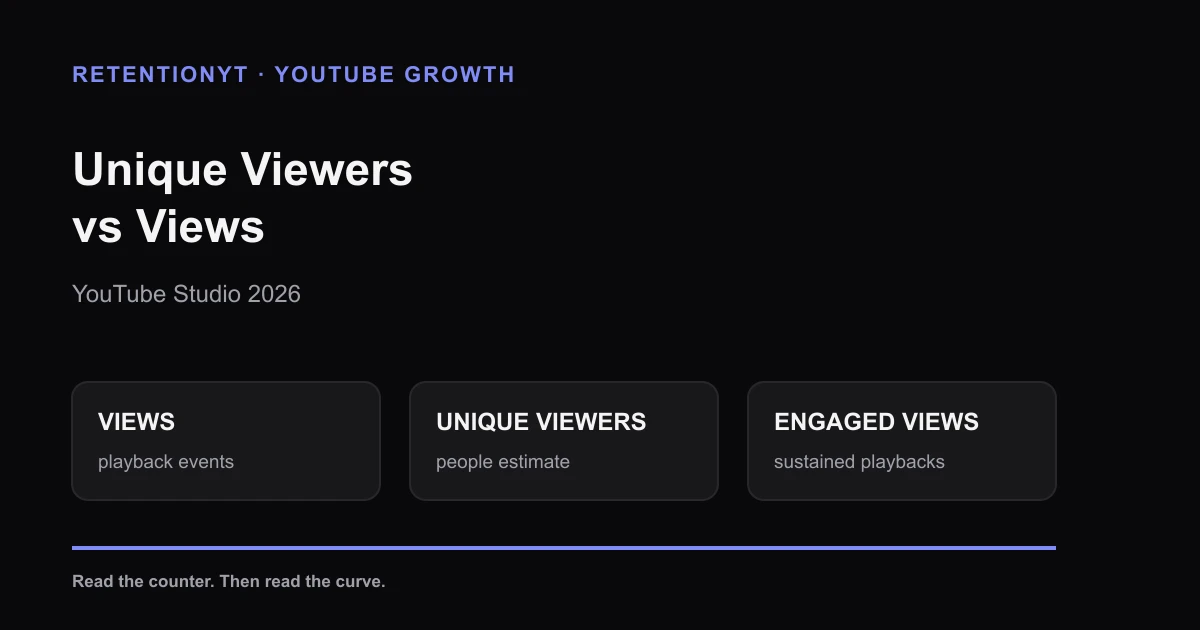
The short version is that you are looking at three different counters, not three competing scores. Views count playback events. Unique viewers estimate the number of distinct people in the selected period. Engaged views count viewers who stayed beyond the first frame and initial seconds, which makes them useful when you compare the new counting model with older reports.
YouTube’s Creator Insider update says the first-frame model began on August 24, 2026. The YouTube Help explanation says views are counted when playback starts across Shorts, long-form video, and live streams, while YPP earnings continue to use engaged views and engaged watch hours. That is the product change you need to account for; it is not a reason to throw away retention.
| Metric | What it counts or estimates | Question to ask |
|---|---|---|
| Views | Playback events, including eligible first-frame starts | How many public playback events were recorded? |
| Unique viewers | Estimated distinct people in the selected period | How many people may this content have reached? |
| Engaged views | Viewers who continued past the first frame and initial seconds | How many playbacks showed more intentional watching? |
A view is not the same thing as an impression. Seeing a thumbnail without playback remains an impression, while a hover or other autoplay that starts the video can now create a view from the first frame. A click-to-play still counts as a view and an engaged view when the viewer continues past the initial moment.
Unique viewers are also not a perfect headcount. They are an estimate shaped by YouTube’s reporting, selected dates, format, device, and audience overlap. Use the number to discuss estimated reach, not to claim that every person has been identified exactly once.
Why this shows up in YouTube Studio
The change makes public view counts more consistent across formats, but it also changes how quickly the top-line number can move. A creator whose traffic includes previews, Shorts-feed playback, or hover autoplay may see views rise faster than the number of people who meaningfully watched.
Label every number as “public views,” “estimated unique viewers,” or “engaged views,” then add the date range and format. A first-frame event tells you playback began; the retention curve tells you whether the promise held attention and reached the payoff.
If you want the companion distinction between accumulated minutes and viewer hold, use Watch Time vs Retention. If you are reviewing the first 30 seconds of a script before filming, the YouTube retention tool can shorten the manual review; the manual method below still works without signing up.
Worked example 1: the failure
Suppose you publish a 6-minute tutorial on August 24, 2026. In the selected 48-hour window, YouTube shows 10,000 views and 6,200 unique viewers. The public number looks exciting, but you open the retention report and see a sharp fall before the first 30 seconds, followed by a second dip when the video finally explains the promised step.
| Illustrative metric | Illustrative result | What it means |
|---|---|---|
| Public views | 10,000 | Playback events, not ten thousand confirmed people |
| Unique viewers | 6,200 | Estimated distinct people in the selected period |
| Engaged views | 7,100 | More useful than raw views for a historical comparison |
| Retention at 0:08 | 58% | The opening is losing viewers before the proof |
| Retention at 0:30 | 44% | The intro is not delivering the promise quickly enough |
These figures are illustrative, not YouTube benchmarks or a real channel dataset. The failure is not that views exceed unique viewers; repeats and first-frame starts can create that relationship. The failure is that you read the largest number as proof of satisfaction and then keep a slow opening because the public counter looks healthy.
The better question is narrower: where did the curve change slope? If the cliff sits at the greeting, logo animation, or unfulfilled promise, the next edit needs a faster start. If the cliff sits after a clear payoff, preserve the idea and repair the transition around it.
Worked example 2: the fix
Use the same upload pattern, but change the next video rather than chasing the view counter. Start with the result in the first sentence, show the evidence by second 8, and remove the two sentences that explain why the tutorial matters before the tutorial begins.
The revision is a cleaner test: did a more direct opening keep more viewers through the first 30 seconds while the topic and format stayed comparable?
Record the numbers at the same reporting window. Suppose the next illustrative report shows 8,400 views, 5,900 unique viewers, 6,700 engaged views, and 62% retention at 0:08. The public view total is lower, but the opening is doing more of the work you actually want.
The lesson is not “always choose engaged views” or “ignore views.” The lesson is to match each number to its job. Public views describe playback scale, unique viewers describe estimated people reached, engaged views help you compare intentional watching, and the curve tells you where the script earns or loses attention.
This is also where you should test your transition into the first useful section. If the curve steadies after the promised result, move that result earlier next time. If it drops when you ask for a subscription, study CTAs That Don’t Kill Retention and place the ask after a real payoff rather than at a fixed timestamp.


How to check this in YouTube Studio (step by step)
Open YouTube Studio and select the video or channel Analytics view you normally use. Choose one date range, one format, and one traffic context before you copy any number. If Studio presents different reports for the video and channel views, keep them in separate rows instead of combining them.
First, record public views exactly as labelled. Do not rename them “people.” Next, record unique viewers if that estimate is available for the report and date range. Then look for engaged views or the closest engaged-view report exposed for the format, and note that the label may differ as YouTube updates its analytics surfaces.
Now open the retention report. Mark the first 8 seconds, the first 30 seconds, the first obvious dip, and the strongest sustained section. The 8-second checkpoint is a working editorial checkpoint, not a platform-wide pass mark; use it to inspect your opening sentence and visual proof.
Compare like with like. A Shorts playback, a long-form click, an external embed, and a channel total answer different questions, so keep the upload date, format, traffic source, report name, and selected dates in your notes.
Finally, write one decision, not five. If the curve falls before the promise, rewrite the first 8 seconds. If it falls after the promise, repair the transition. If the curve is stable but unique viewers are lower, improve distribution or topic fit instead of rewriting a hook that is already holding.


Where RetentionYT fits
Manual method works alone. Product shortens the loop. Use RetentionYT when you want a script-level pass on hooks, pacing, and likely drop-off points before you record.
The trap
The trap is optimising the counter you can see fastest. A first-frame view is useful evidence that playback began, but it is weak evidence that your first 8 seconds worked. Unique viewers help you estimate people reached, but they cannot tell you whether those people stayed for the explanation.
The second trap is building a ratio and treating it as a universal health score. Views divided by unique viewers can hint at repeat playback or surface mix, but it is a diagnostic clue, not a benchmark you should force every upload to hit.
The third trap is changing the thumbnail when the curve says the opening is the problem. Packaging earns the chance to start; delivery earns the next second. Separate those jobs before you decide which asset needs a rewrite.
The trap
The move

A view tells you playback started. Your curve tells you why the viewer stayed.
What to do in the next upload
Use the same measurement habit on the next upload, even if the numbers are small. Pick a comparison window, label every counter, inspect the first 8 seconds and 30 seconds, and make one edit that answers the largest visible drop.
- Write the upload date, format, title promise, and selected analytics window.
- Record views without relabelling them as people.
- Record unique viewers as an estimate of distinct people reached.
- Record engaged views when the report makes them available.
- Mark the retention curve at 0:08 and 0:30.
- Find the first meaningful cliff and name the sentence or transition beside it.
- Rewrite one opening or transition; do not change the whole package at once.
- Recheck the next comparable upload before drawing a trend.
- Report the metric name, date range, format, and source whenever you share results.
The manual loop is enough: open Studio, copy the counters, read the curve, and rewrite the next weak moment. RetentionYT can map that review back to the script before recording, but the decision still belongs to you.
If a sponsor asks for reach, show unique viewers and explain that it is an estimate. If they ask for public scale, show views and label the first-frame model. If they ask whether the audience actually watched, show engaged views and the retention curve together.
The 2026 change makes one old shortcut less reliable: assuming a public view equals a person who settled in. Keep the counters separate, keep the date range visible, and optimise the curve your next viewer has to experience.
Frequently asked questions
- What is a unique viewer on YouTube?
- A unique viewer is YouTube's estimate of the number of distinct people who watched your content during the selected period. One person can generate several views, but the unique-viewer estimate is intended to count that person once for the period. It is an audience-size estimate, not a playback counter, so the two numbers will not normally match.
- Why are views higher than unique viewers?
- Views count playback events, while unique viewers estimate distinct people. A viewer can watch more than once, replay a section, return from another surface, or trigger a first-frame playback through autoplay. Those events can increase views without adding another unique viewer, so a larger view count is expected.
- Did 2026 make this worse?
- It can widen the gap on surfaces where a video begins playing automatically. From August 24, 2026, YouTube counts a view when playback starts from the first frame across formats, while engaged views remain the better comparison for historical performance. The size of the gap depends on your traffic mix and viewer behaviour.
- Which metric should I report to a sponsor?
- Report the metric that matches the question, and label it clearly. Use views for the platform's public playback scale, unique viewers for estimated people reached, and engaged views when a sponsor needs a more comparable view of intentional watching across periods. Include the date range, format, and source report instead of presenting one counter as the whole audience.
- Does retention use unique viewers?
- No. Audience retention describes how viewers continue through a video during playbacks, and YouTube's engaged-view framework remains central to that analysis. Unique viewers answers who may have watched; the retention curve answers what happened after playback began. Read the curve and its first 30 seconds rather than using unique viewers as a retention substitute.
- How do I apply “Unique Viewers vs Views in YouTube Studio 2026” on my next upload?
- Before publishing, write down the upload date, format, and promise. After the first meaningful reporting window, record views, unique viewers, engaged views where available, and the retention curve in the same date range. Compare like with like, then rewrite the first 8 seconds or the next transition based on the curve, not on the largest counter.
- Where in YouTube Studio do I check “Unique Viewers vs Views in YouTube Studio 2026”?
- Open YouTube Studio, choose the video or channel Analytics view, and select the audience or reach reports that expose the available viewer estimates and playback metrics. The exact labels can vary by format, surface, account, and reporting update. Record the report name and date range beside each number so your comparison remains reproducible.
- What is the most common mistake with “Unique Viewers vs Views in YouTube Studio 2026”?
- The common mistake is treating views, unique viewers, engaged views, and retention as interchangeable proof of the same thing. They answer different questions. A creator sees views rise, assumes more people stayed, and changes the script or thumbnail without checking the first-frame effect and the retention curve.
Give your next script a second look
Paste a script into RetentionYT for suggestions on your hook, pacing, and structure. Choose the edits that serve your video, then check audience behavior in YouTube Analytics after publishing.
Get retention tips in your inbox
Occasional, practical emails on hooks, pacing, and retention. No spam.
Related posts
Update Video vs New Video: When to Rescript
Should you update an old YouTube video or make a new one? Compare the promise, metric meaning, and workflow before you rescript, annotate, or publish a fresh lesson.
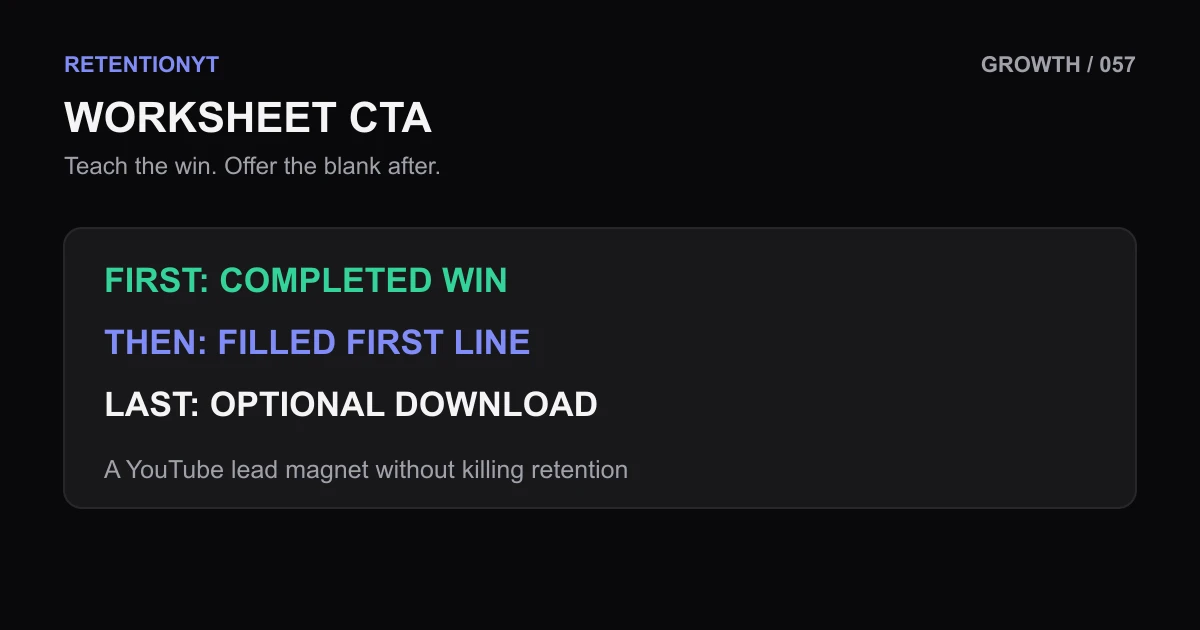
Worksheet CTA: Why It Should Come After the Win
Use a YouTube lead magnet without killing retention: teach one completed win first, then show the filled worksheet line before offering the blank PDF.
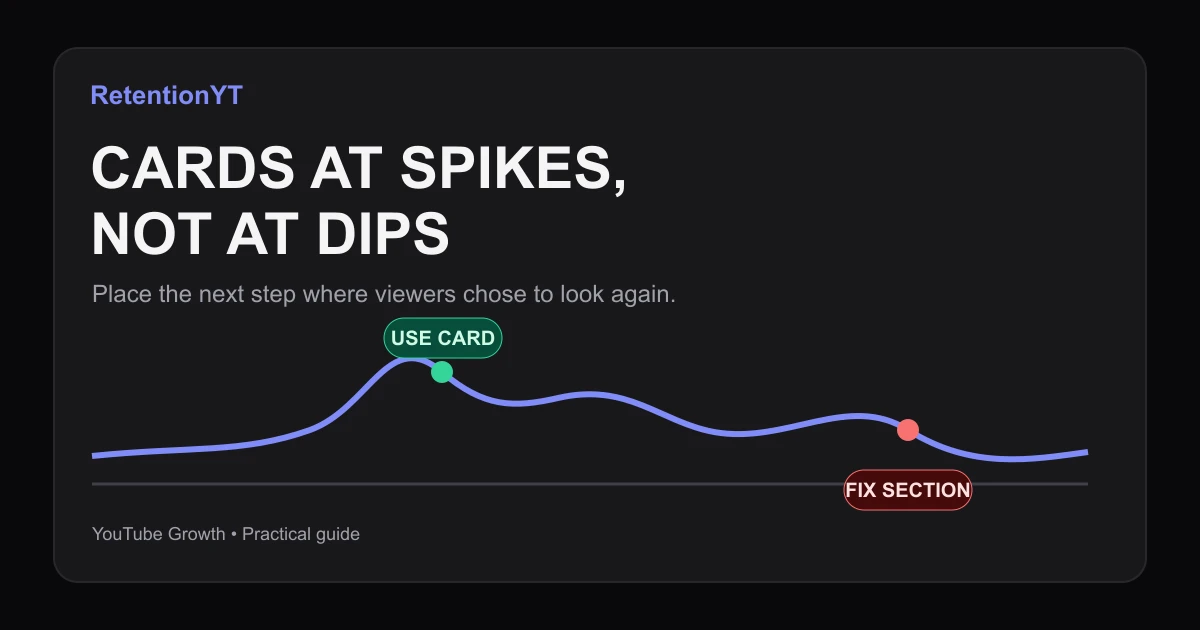
Cards at Spikes, Not at Dips
Learn when to place YouTube cards retention: use rewind spikes as demand signals, avoid dips, and follow a practical Studio workflow on your next upload.