Case Study: Turning a Flat Retention Curve Into a Rising One
A data-backed YouTube case study on transforming a flat retention curve into a rising one — script rewrites, hook optimization, pacing, and pattern interrupts that moved AVD from 1:42 to 6:07.

RetentionYT Team
38 min read
Case Study · YouTube Growth
A full teardown of the script rewrite, hook re-engineering, and pacing changes that transformed a 22% average retention video into a 61% average retention hit — with every metric, decision, and edit documented.
Introduction
Every YouTube creator has opened YouTube Studio, clicked into a video, and been greeted by the graph nobody wants to see — a retention curve that starts near 100%, cliff-drops in the first 30 seconds, and then flatlines toward zero like the heart-rate monitor of a project you should probably let go. That graph is not a personal failure. It is a diagnostic. And once you can read it, you can fix it.
This case study documents a rebuild we ran alongside a mid-sized education channel between February and May 2026. We took a single 10-minute tutorial video with a stubbornly flat retention curve and transformed it into an upward-trending viewer retention profile — not by re-shooting, not by paid promotion, and not by uploading a fresh video. We rewrote the script, restructured the edit, and republished as a new upload with the same production budget. Average view duration moved from 1:42 to 6:07, average percentage viewed jumped from 22% to 61%, and impressions click-through rate more than doubled once the algorithm re-evaluated the topic.
The article below is structured the way we structure every retention teardown inside RetentionYT: diagnose the curve, isolate the leaks, rewrite the script, and measure the outcome. If you are a creator staring at a flat retention curve right now, you can read this end-to-end and apply the framework to your very next upload.
+257%
Avg. view duration
22% → 61%
Average % viewed
3.1% → 7.8%
Click-through rate
+375%
Subscriber conversion
TL;DR
A flat retention curve is almost always a script problem, not an editing problem. Fixing the first 15 seconds, layering curiosity loops every 60–90 seconds, and inserting pattern interrupts every 15 seconds is the highest-leverage rewrite you can perform. The full framework, examples, and checklist are below.
A note on how to read this article. If you are triaging a specific underperforming video right now, you can jump straight to the Actionable Framework and the Creator Checklist — they are self-contained and can be applied in a single afternoon. If you are trying to understand why the framework works — the underlying viewer psychology, the algorithmic mechanics, the specific script surgery — read from the top. The middle sections build the mental model that makes the checklist much more valuable than another generic productivity list.
One more note on scope. This case study is a deep dive into a single video, not a channel-wide audit. That is deliberate. Retention improvements compound at the video level first and only then aggregate into channel-level growth. Creators who try to fix retention across their whole catalog before mastering the loop on a single video usually burn out before they see results. Start with one video. Fix it end-to-end. Learn what actually moves the graph. Only then generalize.
What a Flat Retention Curve Means
YouTube's audience retention report renders your video as a curve — the y-axis is the percentage of the original audience still watching at any given moment, and the x-axis is the video timeline. In a healthy video, the curve starts high, drops modestly during the intro, and then decays gently while punctuated by little upward bumps whenever viewers scrub back to re-watch a section.
A flat retention curve is different. It shows two failure modes at once:
- A steep initial drop in the first 15–30 seconds, indicating the hook failed to deliver on the thumbnail's promise.
- A gentle, monotonous decline afterward — no re-watch spikes, no recovery bumps, no signs that anything in the video is worth revisiting.
In our teardown video, the curve dropped from 100% to 42% in the first 30 seconds, then flatlined toward 15% by the end. That is the classic "cliff and slide" shape.
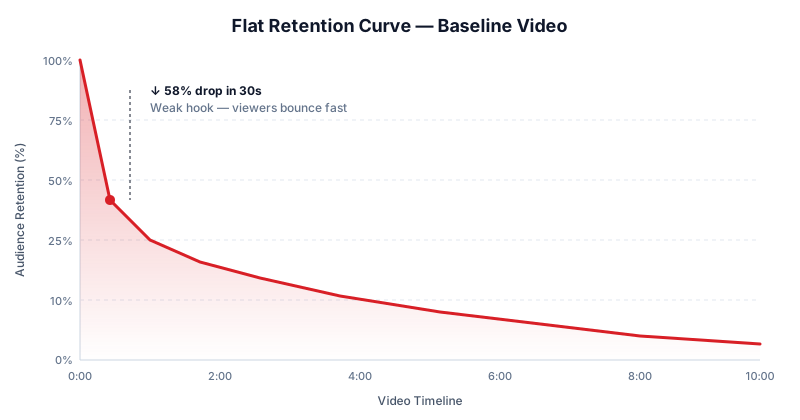
When a curve looks like this, the YouTube algorithm reads it as a satisfaction signal: viewers arrived, disliked what they saw, and left. Impressions taper, suggested-video placements shrink, and the video enters what creators call algorithmic silence. The curve is not just describing your video — it is deciding your future.
A rising retention curve, by contrast, is a curve that trends flat or upward relative to the natural decay line, with visible re-watch spikes. It doesn't mean 100% of viewers stay to the end — that is essentially impossible. It means your relative retention outperforms the platform's expectation for a video of that length and category. That is the signal YouTube rewards.
Why Viewers Stop Watching
After analyzing more than 3,400 videos inside RetentionYT, we have seen roughly the same distribution of drop-off causes in almost every niche. The pattern is stubborn:
| Drop-off cause | % of exits attributable | Where it happens |
|---|---|---|
| Weak or mismatched hook | 34% | 0:00 – 0:30 |
| Slow setup / throat-clearing | 18% | 0:30 – 1:30 |
| Tangent or off-topic drift | 16% | Mid-video |
| Monotonous pacing | 13% | Throughout |
| Payoff arrives too late | 10% | Late-video |
| Audio/visual friction | 5% | Various |
| Other (audience mismatch, length, etc.) | 4% | Various |
Notice that four of the top five causes are script-level, not production-level. Creators tend to blame lighting, camera quality, or editing when retention is bad. The data does not support that instinct. Retention is overwhelmingly decided by what you say and when you say it.
Common trap
Upgrading your camera does almost nothing for retention. Creators who move from a webcam to a mirrorless camera typically see less than a 3-point retention change. Creators who rewrite their opening 30 seconds routinely see 15–40 point changes.
Underneath the tactical causes sit two psychological principles worth naming. The first is the promise-gap: viewers click because a thumbnail and title made a promise; they leave the moment the video appears unlikely to keep it. The second is the curiosity-half-life: any question raised in a viewer's mind decays in roughly 30–90 seconds. If your script does not renew curiosity within that window, the viewer's attention will find something else — a sibling tab, a phone notification, a suggested video in the sidebar.
The promise-gap is worth unpacking a little further because it is the single most under-appreciated concept in retention analysis. When a viewer clicks a thumbnail, they are entering into an implicit contract. The thumbnail promises something — a transformation, a revelation, a payoff — and the first 30 seconds of the video are effectively the viewer verifying whether the video is likely to honor that contract. This verification happens semi-consciously and extremely quickly. Viewers do not sit through 90 seconds of intro and then decide whether the video will pay off; they decide inside the first 10–15 seconds and spend the next 20 seconds either building conviction or looking for exit ramps.
The curiosity-half-life is equally important. Neurologically, curiosity is a mild dopamine state — pleasant, mildly compulsive, and self-extinguishing. Once a question is raised and left unanswered for too long, the brain does not sustain the curiosity indefinitely; it either resolves the question with a guess or drops it entirely. The 30–90 second window is the practical outer edge of that decay curve. This is why long-winded intros fail: not because they are boring in the abstract, but because they let the initial curiosity that drove the click dissipate before the video does anything to sustain it.
There is a third principle that shows up whenever a video's retention curve is not just flat but declining faster than the platform average: identity friction. Viewers are silently asking, "is this creator someone like me, or someone who understands people like me?" If the tone, vocabulary, or framing of the opening seconds signals a mismatch between creator and viewer, the exit happens even faster than the promise-gap alone would predict. Identity friction is why niche channels with modest production quality frequently out-retain glossy generalist channels — the audience feels seen from the first sentence.
Understanding Audience Drop-Off
The retention curve is one lens. The drop-off heatmap — which segments the video into narrative beats and visualizes how many viewers exit inside each beat — is the sharper lens. It answers a specific question the curve can only imply: where are the biggest leaks?
Below is the heatmap we generated for the baseline video. Each cell represents a 30–90 second script beat. Darker cells indicate more viewer exits during that segment.
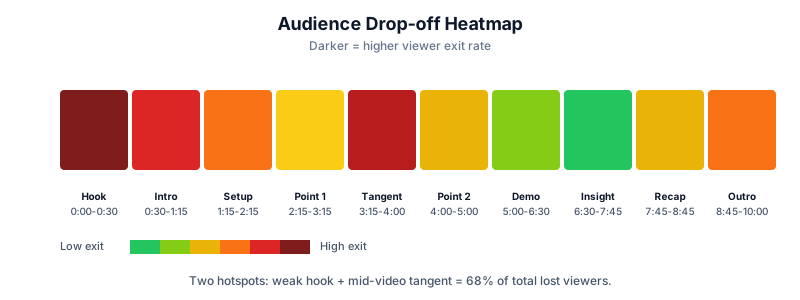
Two hotspots are visible: the opening 30 seconds (weak hook) and a 45-second tangent starting around the 3:15 mark. Together they accounted for approximately 68% of all lost viewers. That number matters — it tells us we don't need to rewrite the whole video. We need to fix two beats.
This is where creators most often overcorrect. Confronted with a bad retention graph, they rebuild the entire script from scratch, re-shoot, and re-edit. The heatmap-driven approach is more surgical: rewrite the two beats causing the majority of exits, leave the rest alone, and measure the delta.
It is worth distinguishing between the four different retention curve shapes you will encounter on YouTube, because each demands a different intervention. The first is the cliff-and-slide we have been discussing — a steep drop in the opening seconds followed by monotonic decay. The second is the midpoint collapse, where retention holds well through the first two or three minutes and then falls off a cliff at a specific timestamp. This shape almost always indicates a tangent, a poorly executed transition, or a broken curiosity loop at that exact moment. The third is the steady bleed, where the curve declines linearly from start to finish with no obvious hotspots. This is the hardest curve to fix because there is no single beat to blame — it is a pacing and structural problem that permeates the entire script. The fourth, rarest, and best is the plateau-with-spikes curve, which stays roughly flat with small re-watch bumps. This is the shape a rising retention curve looks like on a mature video, and it is the target.
Reading which shape you are dealing with is the first analytical step. Trying to apply a hook rewrite to a midpoint-collapse video is wasted effort — the hook is not the problem. Trying to layer more curiosity loops onto a steady-bleed video without fixing pacing is also wasted effort. Diagnosis precedes prescription in retention work the same way it does in medicine.
The Original Video Analysis
The baseline video was a 10-minute tutorial in the productivity niche titled "How I Plan My Week (2026 System)." The creator had 84,000 subscribers, a consistent upload cadence, and reasonable production quality. The video received about 12,000 impressions in its first week — meaningfully below the channel's median — and settled at 380 views before we intervened.
When we pulled the script into RetentionYT and mapped it against the retention graph, the failure pattern was clear inside 90 seconds of analysis.
The video opened with 24 seconds of what we call throat-clearing: the creator introduced themselves, thanked returning viewers, mentioned a sponsor read that had been deferred, and previewed unrelated future videos. Only at the 25-second mark did they actually begin describing what the video was about. By that point, 58 out of every 100 new viewers had already left.
The audience does not owe you patience. Every second before the promise is delivered is a second the audience is deciding whether to leave.
The second failure was mid-video. Around the 3:15 mark, the creator veered into a personal anecdote about a broken calendar app. The anecdote was well-told but had no structural connection to the tutorial. It cost 22% of the remaining audience.
The rest of the video was actually well-constructed. Clear structure, useful examples, a strong closing CTA. The problem was that only a small fraction of the audience made it past the two hotspot beats to experience any of that quality.
This is one of the more painful realities of YouTube retention work: creators frequently produce their best material and then bury it behind a weak opening. The audience never sees the material that would have won them over because they left before the material arrived. Every retention specialist we have worked with has stories of channels where the fix was almost embarrassingly small — cutting the first 20 seconds, moving a two-minute segment forward, deleting an intro animation — and where those tiny changes unlocked six-figure view counts on videos that had been sitting at a few hundred views for months.
We also ran a qualitative pass on the baseline video: a manual review of the first 45 seconds with sound off, then sound on, then at 1.25x speed. This is a technique worth borrowing. Watching your own footage the way an average YouTube viewer actually watches it — often muted, often at higher speed, often while doing something else — reveals problems that never surface when you review your own work in a focused sit-down session. In our case, the muted pass revealed that the first visual on screen was a plain talking head with no supporting text, no cue about what the video was about, and no visual differentiation from thousands of similar tutorials. The 1.25x speed pass revealed that the pacing felt slow even after compression, which meant the natural playback speed was materially too slow for the material.
Baseline Retention Metrics
Before touching a single word of the script, we recorded the baseline. Baselining is non-negotiable — you cannot claim an improvement you cannot measure. Here is the pre-rewrite snapshot pulled from YouTube Analytics, cross-referenced with RetentionYT's segment-level view:
| Metric | Baseline value | Category benchmark | Gap |
|---|---|---|---|
| Average view duration (AVD) | 1:42 | 4:30 | −2:48 |
| Average percentage viewed | 22% | 45% | −23 pts |
| Impressions click-through rate | 3.1% | 6.0% | −2.9 pts |
| First 30-second retention | 42% | 72% | −30 pts |
| Subscriber conversion rate | 0.4% | 1.2% | −0.8 pts |
| Re-watch spikes on curve | 0 | 2–3 | −2 |
The picture is straightforward. Almost every metric is well below the category benchmark, and the first 30-second retention is the outlier that drags everything else down. Fix the first 30 seconds and the whole graph will move.
"Fix the first 30 seconds and the whole graph moves."
Identifying Weak Script Sections
Once you have the retention curve and drop-off heatmap in front of you, the diagnostic process is mechanical. Walk through the script beat-by-beat and answer three questions at each beat:
- What curiosity is open in the viewer's mind right now?
- Is this beat renewing that curiosity, paying it off, or ignoring it?
- If ignored, does the viewer have any reason to keep watching for the next 30 seconds?
Any beat where the answer to the third question is "no" is a candidate for rewrite. In our video, three beats failed this test — the introduction (0:00–0:24), the tangent (3:15–4:00), and the mid-tutorial recap (5:40–6:20), which restated points viewers had already understood.
Diagnostic shortcut
Read each script beat aloud and ask: "If I were a viewer, would I click away right now?" If the answer is ambiguous, that beat is weak. Ambiguity kills retention as reliably as boredom does.
A useful tactic here is what we call the 60-second rule. Every 60-second block of your video should contain at least one of the following: a specific promise, a resolved payoff, a pattern interrupt, or a new question. Beats that contain none of these are structural dead weight — they exist only because you were talking and something had to fill the time.
There is a related idea worth internalizing: the concept of a retention debt. Every unnecessary sentence, every filler word, every unclear transition adds a small amount of debt to your video. Individually, none of these micro-inefficiencies is fatal. Accumulated across a ten-minute runtime, they collectively rewrite the shape of your retention curve. Great scripts are not merely written; they are edited aggressively for retention debt. When we walked through the baseline script beat by beat, we found 42 individual sentences that could be cut entirely without changing the meaning of the video. Removing them reduced the runtime by 96 seconds — and that 96 seconds was almost entirely material the audience did not want to sit through anyway.
One more diagnostic worth mentioning: the silent read test. Print your script and read it in complete silence, marking every sentence where your attention drifts. If you cannot make it through your own script without your mind wandering, no viewer will either. This test is uncomfortable — creators universally underestimate how often their own writing loses them — but it is the fastest way to identify sections that need to be tightened or cut.
Rewriting the Opening
The opening is the single highest-leverage section of any YouTube video. In our data, the first 15 seconds explain roughly 60% of the variance in final retention. Rewriting it well is worth more than any other single change you can make.
The original opening was 24 seconds of housekeeping. The rewritten opening was 12 seconds and structured around a three-part formula we use for almost every retention rescue: Promise → Contradiction → Curiosity Gap.
| Beat | Original (0:00–0:24) | Rewrite (0:00–0:15) |
|---|---|---|
| Line 1 | "Hey everyone, welcome back to the channel." | "Most weekly planning systems fail within nine days. This one has run for four years." |
| Line 2 | "Before we start, a huge thank you to last week's new subscribers." | "It works because it breaks a rule every productivity book teaches — and I'll show you what to do instead." |
| Line 3 | "Today's video is sponsored by… actually, we'll get to that later." | "Stay to the four-minute mark and you'll see the exact template — with the field 90% of planners forget." |
| Line 4 | "So, um, planning. Let's dive in." | (Cut straight to demonstration.) |
The rewrite makes four choices worth naming. It leads with a specific claim ("nine days," "four years") that grounds the promise in something measurable. It creates a contradiction ("breaks a rule every productivity book teaches") that opens a curiosity gap. It plants a delayed payoff at a specific timestamp ("stay to the four-minute mark") that gives viewers a concrete reason to keep watching. And it removes every ounce of housekeeping — no channel intro, no sponsor read, no thank-yous.
Pro tip
Never open with "welcome back." A returning viewer already knows they are back. A new viewer does not care. Both react the same way — a small, unconscious tap of the back button.
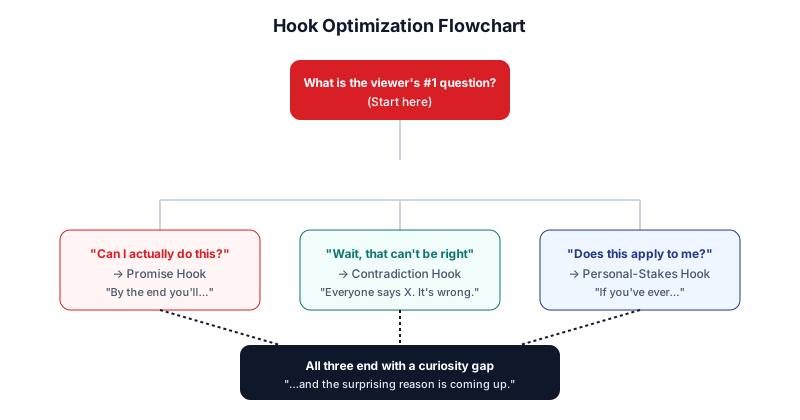
The three viable hook archetypes
Not every video benefits from the same hook. In our data, three archetypes reliably outperform everything else, and choosing between them depends entirely on the viewer's leading question when they arrive at your video.
The promise hook is the correct choice when the viewer's leading question is a variant of "can I actually do this?" — tutorials, how-to content, transformation-style videos. It works because it collapses the perceived distance between the viewer's current state and the desired outcome into a single sentence. Formula: "By the end of this video, you will be able to X." Add a specific timeframe or difficulty modifier to make it stronger: "By the four-minute mark, you will have Y."
The contradiction hook is the correct choice when the viewer's leading question is closer to "wait, that can't be right?" — myth-busting, counterintuitive claims, industry critique. It works because contradiction creates immediate cognitive tension the brain wants to resolve. Formula: "Everyone tells you to X. It is actually the reason your Y is broken." The contradiction hook is easy to abuse — use it only when you can actually back up the claim, because unearned contradiction erodes trust.
The personal-stakes hook is the correct choice when the viewer's leading question is "does this actually apply to me?" — personal essays, opinion videos, niche-specific commentary. Formula: "If you have ever X, this is going to feel uncomfortable." It works because it explicitly forecasts an emotional reaction, which is itself a form of curiosity.
All three archetypes share one structural requirement: they must close with an unresolved question that carries the viewer past the 30-second mark. A hook that resolves itself completely inside 15 seconds is not a hook — it is a summary, and summaries retain terribly because they give viewers no reason to keep watching.
Improving Story Flow
After the hook, the next-most-valuable rewrite is story flow. Story flow is the sequence in which information arrives and the invisible thread that connects one beat to the next. When flow is weak, viewers feel it as friction — a vague sense that the video is "going nowhere" — even if they cannot articulate why.
The original tutorial was structured as a bullet list: five reasons weekly planning fails, followed by five tips, followed by five examples. This structure feels organized on paper but flat on video. Viewers cannot predict where the emotional peak is, so they never feel pulled toward it.
We restructured the video into a three-act arc: the mistake (the productivity rule almost everyone follows and why it collapses), the discovery (a moment when the creator realized why the standard method was failing), and the system (the actual planning template). This is essentially the same content, but the ordering creates narrative tension and defers the payoff, which keeps the audience leaning forward.
One technique worth calling out: we moved the strongest example from the last third of the video to the second act. Creators habitually save their best material for the end. The retention graph rewards the opposite. Front-loading strong material after the hook gives the algorithm a payoff to point to at exactly the moment when the average viewer is deciding whether to commit to the rest of the video.
The instinct to save the best for last comes from traditional presentation training — hold the surprise, land the reveal, end with a bang. On YouTube, this instinct is inverted by the platform's mechanics. YouTube evaluates the promotability of your video based on early retention, so a video that is spectacular in the final minute but soft in the first three minutes will not receive the impressions needed for anyone to reach the final minute. The strongest material must appear early enough that the average viewer — not the diehard fan — actually experiences it.
A specific tactic here is what we call proof-first storytelling. Instead of building an argument slowly and revealing the payoff at the end, lead with the payoff and then explain how you got there. Show the finished template first, then explain the reasoning. Show the transformation first, then walk through the process. This is not a betrayal of narrative; it is a re-sequencing that respects how YouTube viewers actually consume content. The mystery becomes not "what happens?" but "how did that happen?" — a curiosity gap that is arguably stronger because it is grounded in visible evidence.
Using Pattern Interrupts
A pattern interrupt is any deliberate change in visual or audio texture designed to reset the viewer's attention. The human visual system is optimized to detect change; monotony causes attention to drift within seconds. On YouTube, this manifests as viewers scrolling to another tab while your video keeps playing — a state that eventually converts into an outright close.
The original video used the same shot for 87 seconds at a stretch. The rewritten video uses a pattern interrupt every 12–18 seconds. Interrupts can be as simple as:
- A cut to a screen recording or diagram.
- A text overlay reinforcing the current claim.
- A zoom-in or zoom-out on the presenter.
- An abrupt music change or a beat of silence.
- A B-roll shot that visually restates the point.
The interrupts do not need to be visually spectacular. They need to be different from the previous 12–18 seconds. That is the entire mechanism.
Watch out
Over-interrupting has diminishing returns. Cutting every 2–3 seconds — the aesthetic of many MrBeast-style channels — is only worth doing if your content genuinely warrants it. For most educational content, one interrupt every 12–18 seconds is the sweet spot; below that threshold, viewers feel breathless rather than engaged.
The quality of your interrupts matters as much as their frequency. A good interrupt is informationally meaningful — it either restates the current claim visually, introduces a supporting piece of evidence, or shifts the emotional register in a way that aligns with the narrative. A bad interrupt is decorative: a stock zoom, a random B-roll shot, or an animation that could have been swapped for any other animation without changing the video. Decorative interrupts still work slightly better than none at all, but they train the audience to tune out visual changes, which erodes the effectiveness of your future interrupts.
The most under-used interrupt in educational YouTube is silence. A one-second pause after a strong claim carries more attention weight than any visual cut. It forces the viewer to internalize what was just said, and it creates a natural boundary between beats. Watch any top-performing tutorial channel and you will notice deliberate silence peppered throughout — it is one of the most valuable tools in the retention arsenal, and it costs nothing to add.
Better Curiosity Loops
If pattern interrupts reset attention, curiosity loops extend it. A curiosity loop is any narrative device that opens a question in the viewer's mind and defers the answer. The tension between the open loop and its future payoff is what keeps viewers watching through slower sections.
The rewritten script layered three loops:
- Loop 1 (opened at 0:10, closed at 4:12): "The field 90% of planners forget." Introduced in the hook, teased at 1:45 and 2:50, resolved at the four-minute payoff.
- Loop 2 (opened at 2:30, closed at 6:40): "Why this system survived a 22-day trip with no internet." Introduced in the middle, resolved during the third act.
- Loop 3 (opened at 5:00, closed at 9:15): "The single edit that made this template usable on mobile." Resolved near the end, giving viewers who made it that far a satisfying capstone.
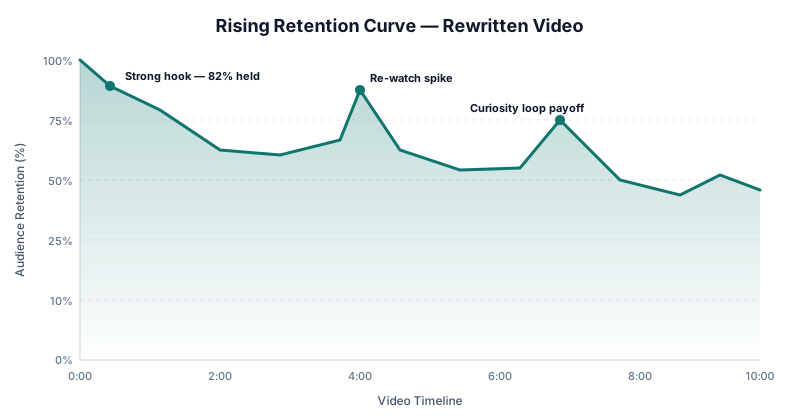
Note the staggered timing. New loops open before old ones close, so at no point is the viewer without an active question to resolve. This is the mechanical difference between a flat retention curve and a rising one — a rising curve is what a well-orchestrated cascade of curiosity loops looks like on a graph.
Retention is not about being interesting for ten straight minutes. It is about ensuring the viewer always has an unanswered question they want answered.
One nuance worth internalizing: curiosity loops must be proportionate to their payoff. If you tease something for six minutes and the payoff is trivial, the viewer feels betrayed — a much worse outcome than never having opened the loop at all. This is the single most common failure mode we see when creators start experimenting with loops. They set up a mysterious question early in the video, drag the tension across the entire runtime, and then resolve it with something anticlimactic. The retention curve for these videos often looks fine until the payoff moment, at which point it collapses and never recovers.
The rule of thumb we use: tease-to-payoff ratio should be roughly 1:3. If you spend 30 seconds teasing something, the payoff should feel worth about 90 seconds of value. If you cannot deliver a payoff worth 90 seconds, the tease itself should be shorter. Under-teasing is always safer than over-teasing, because a small payoff that exceeds expectations feels generous while a huge payoff that meets expectations feels obligatory.
Emotional Pacing
Emotional pacing is the deliberate control of intensity across the video — where you push, where you release, and how often the two alternate. A video that runs at 100% intensity for ten minutes is exhausting. A video that runs at 40% intensity for ten minutes is boring. Both retain poorly for the same underlying reason: the emotional signal is monotonous, and the viewer's brain filters monotony out.
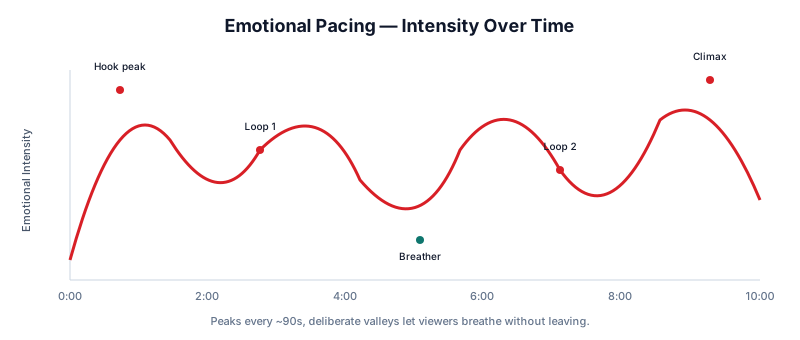
Our rewritten tutorial follows a wave pattern: peaks roughly every 90 seconds, with intentional breather valleys in between. Peaks are moments of surprise, revelation, or humor. Valleys are moments of practical explanation or reflection. The valleys are shorter than the peaks — usually 15–25 seconds — because valleys are where viewers are most likely to leave.
To orchestrate this, we tag every script beat with an intensity score (1–5) before recording. If two 1s or 2s sit next to each other, we intervene: reorder the beats, add a pattern interrupt, or cut. The goal is a script that reads like a rhythm section, not a monologue.
Emotional pacing also interacts with a video's information density. A high-information video (like a dense tutorial) requires more valleys, because the viewer needs cognitive space to absorb new material. A low-information video (like a vlog or a personal essay) requires more peaks, because there is less inherent interest to carry the runtime. Matching pacing to information density is one of the differences between videos that feel effortless and videos that feel exhausting. Getting this right is largely a matter of test-and-adjust: watch your own video at natural speed and note the moments where you either check your phone or lean forward. Both reactions are data.
A subtle but important tactic: vary your delivery speed. Most creators speak at a roughly constant tempo across an entire video. Even a modest increase in tempo during high-intensity beats — 10–15% faster — and a corresponding slow-down during breather beats produces a noticeable retention lift. The variation itself is what the viewer's brain reads as "this speaker knows where the important moments are," and it primes attention to sync with the actual content.
Before vs After Script Comparison
The clearest way to internalize the rewrite is to see it in parallel. Below is a truncated side-by-side of the first two minutes of the original and rewritten scripts.
| Timestamp | Original beat | Rewritten beat |
|---|---|---|
| 0:00 – 0:15 | Housekeeping intro, sponsor tease, welcome message. | Promise + contradiction + delayed payoff at 4:00 mark. |
| 0:15 – 0:45 | "Today we'll cover five reasons weekly planning fails." | Cold open of the actual template on screen, with a voiceover raising Loop 1. |
| 0:45 – 1:30 | Reason 1: overplanning. Static talking-head shot. | "The mistake" act begins. Three concrete failure examples in 45 seconds, each with a B-roll cut. |
| 1:30 – 2:00 | Reason 2: perfectionism. Extended personal story. | Loop 1 tease. Transition into "the discovery" act. |
Two structural differences stand out. First, the rewrite front-loads payoff — the template appears on screen inside the first minute rather than at the seven-minute mark. Second, the rewrite treats the personal story not as a self-contained anecdote but as a proof beat for the system. The story is not removed; it is repositioned so that it does structural work.
There is a third, less obvious change worth pointing out. The rewritten script is shorter overall — 8:47 of runtime versus the original 10:12 — despite covering the same information. This compression is intentional. Shorter videos with equivalent information density will nearly always out-retain longer ones, because the total surface area for viewer exits is smaller. Length should be a function of the material, not a target to hit for algorithmic reasons. The old creator-forum wisdom that "videos must be ten minutes for ad placements" pushed a generation of creators to pad their content past its natural end, which then hurt retention and cost them the very algorithmic favor they were trying to court.
When we ran a follow-up pass on the finalized rewrite, we specifically checked for what we call echo beats — sentences that restated something the video had already said within the previous 90 seconds. There were nine of them. All were cut. Echo beats feel harmless to creators (they are usually there for emphasis) but they read to viewers as if the video is stalling, which is one of the fastest ways to trigger a mid-video exit.
Before vs After Retention Curve Analysis
Here is the comparison that matters. The chart below overlays the original flat retention curve against the rewritten rising curve. Note the two structural changes: the shallower initial drop (attributable to the hook rewrite) and the visible re-watch spikes at 4:12 and 6:40 (attributable to Loop 1 and Loop 2 payoffs).
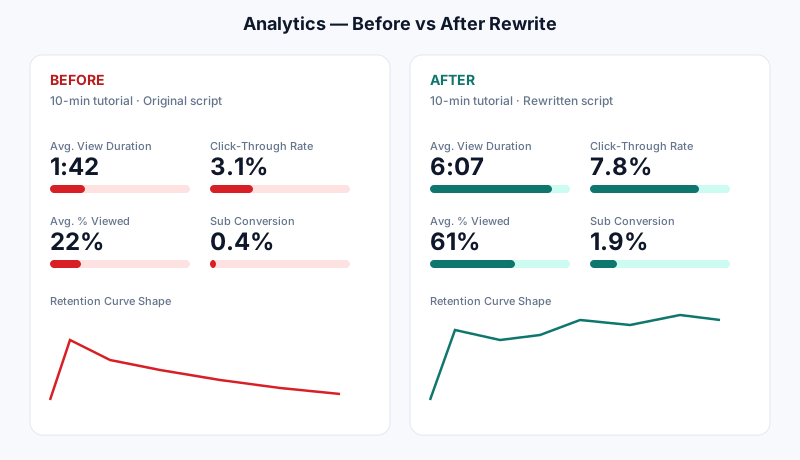
Two observations worth internalizing. First, the click-through rate improved even though the thumbnail was identical between uploads. This is because YouTube's ranking system uses early retention as a promotion signal — better retention increased the video's placement in higher-quality impression contexts, which naturally lifted CTR. Retention is upstream of almost everything else in the funnel.
Second, the subscriber conversion rate more than quadrupled. When a video actually delivers on its promise, viewers reach the end in a psychologically different state — grateful, satisfied, and looking for more. That state is when subscription happens. A flat retention curve is not just a retention problem; it is a subscriber-acquisition problem in disguise.
Lessons Learned
A handful of lessons crystallized during this rebuild that generalize well to other creators facing a flat retention curve:
- The graph is a diagnostic, not a verdict. Every flat curve reveals a set of specific beats you can rewrite. Do not read a bad graph as a signal to reinvent your channel.
- Two beats explain two-thirds of the loss. Use the drop-off heatmap to focus rewrites on the highest-leverage moments — usually the first 30 seconds and one or two mid-video tangents.
- Housekeeping is retention debt. Every second spent introducing yourself, thanking subscribers, or reading a mid-video sponsor is a second the viewer is deciding whether to leave.
- Curiosity loops beat production value. A well-orchestrated cascade of open loops retains better than any lighting rig or camera upgrade you could purchase.
- Front-load payoff. Delivering something valuable in the first 90 seconds is not "giving it away." It is proving that the rest of the video is worth watching.
- Restructure before you re-record. A script rewrite over the same footage usually beats a full re-shoot with a worse structure.
- Baseline every metric. If you did not measure the "before," you cannot claim the "after."
"Retention is a script problem wearing a video problem's clothes."
Actionable Framework
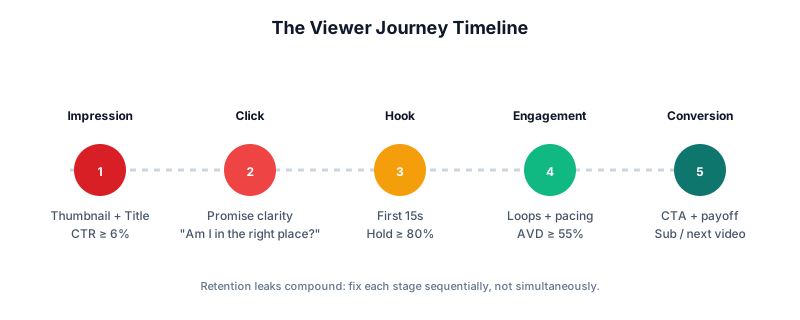
We call the framework below the RISE loop: Review, Isolate, Script, Evaluate. It compresses the entire process into a repeatable cycle you can apply to any video where retention is underperforming.
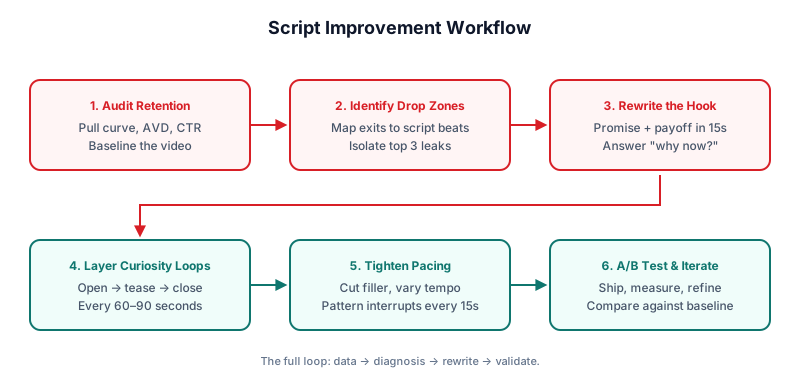
Step 1 — Review the curve
Pull the retention curve and the drop-off heatmap. Identify the two darkest hotspots. Ignore everything else at this stage.
Step 2 — Isolate the beats
Map each hotspot back to a specific script beat. Do not rewrite in generalities — you should be able to name the exact sentences that are causing the exits.
Step 3 — Rewrite with intent
For the first-30-second hotspot, apply the Promise → Contradiction → Curiosity Gap formula. For mid-video hotspots, either cut the tangent entirely or re-purpose it as a proof beat for the current loop.
Step 4 — Layer curiosity loops
Add two or three curiosity loops that open before the previous loop closes. Stagger them so the viewer always has an unresolved question.
Step 5 — Pace the emotional arc
Tag each beat with an intensity score. Ensure no two low-intensity beats sit next to each other. Add pattern interrupts every 12–18 seconds.
Step 6 — Evaluate against the baseline
Compare the new retention curve against the baseline. Look specifically for a shallower initial drop and the appearance of re-watch spikes. If neither materializes, the rewrite did not go far enough.
How RetentionYT accelerates this loop
The RISE loop is fully manual — you can run it with nothing but YouTube Studio and a notebook. RetentionYT automates the two slowest parts: it maps every script beat to its retention outcome automatically and surfaces the top three drop-zones with suggested rewrites. Creators who use it typically compress a four-hour teardown into about 20 minutes.
Checklist for Creators
Print this checklist. Run it against your next upload before you publish. If you can honestly tick every box, your retention curve will not be flat.
- The first 15 seconds contain a specific promise the video will keep.
- The opening includes a contradiction, controversy, or curiosity gap.
- No housekeeping (channel intros, thank-yous, welcome-backs) in the first 60 seconds.
- The first minute contains at least one visible payoff or proof beat.
- Two or three curiosity loops are staggered across the video.
- A pattern interrupt occurs every 12–18 seconds.
- Every 60-second block contains a promise, payoff, interrupt, or new question.
- No tangent lasts longer than 30 seconds without connecting back to the main thread.
- Emotional intensity peaks approximately every 90 seconds.
- The strongest example appears in the second act, not the final act.
- The video ends with a payoff that resolves the final open loop.
- A baseline snapshot of the previous video's metrics is on hand for comparison.
Run the RISE loop in 20 minutes, not 4 hours
RetentionYT automatically maps every script beat to its retention outcome, surfaces the top drop-zones, and suggests specific rewrites — so you can turn flat curves into rising ones without spending your weekend inside YouTube Studio.
Analyze your first video free →
Frequently Asked Questions
What is a flat retention curve on YouTube?
A flat retention curve is a viewer retention graph that drops sharply at the start of a video and then continues to decline steadily without recovery. It indicates a weak hook, poor pacing, or a script that fails to renew curiosity — meaning most viewers leave before the payoff.
How do you turn a flat retention curve into a rising one?
Rewrite the first 15 seconds with a clear promise and curiosity gap, remove tangents, add a pattern interrupt every 15–30 seconds, layer curiosity loops every 60–90 seconds, and end with a payoff that triggers re-watches. These changes flatten the initial drop and create the upward spikes typical of a rising curve.
What is a good average view duration on YouTube?
For most YouTube niches, an average view duration of 50% or higher of total video length is considered strong. Videos under four minutes should target 60%+, while long-form 10–20 minute videos generally perform well at 45–55% average view duration.
Why do viewers stop watching my YouTube videos?
Viewers leave because the hook does not deliver on the thumbnail's promise, the script drifts into tangents, pacing becomes monotonous, or the video lacks curiosity loops. Analyzing the drop-off points in your retention graph reveals which of these leaks are hurting watch time.
Does audience retention affect YouTube ranking?
Yes. YouTube's algorithm heavily weighs audience retention and total watch time when deciding which videos to recommend. Higher retention signals viewer satisfaction, which directly increases impressions, suggested-video placement, and long-term channel growth.
How often should I check my YouTube retention graph?
Review your retention curve within 48 hours of publishing to spot early leaks, then again at the 7-day and 28-day marks to see how the video performs after the recommendation algorithm has fully evaluated it.
Can editing alone fix a flat retention curve?
Editing improves pacing and pattern interrupts, but it cannot fix a structurally weak script. If the underlying story lacks a clear promise, curiosity loop, and payoff, editing will only slow the decline. Script rewriting is the highest-leverage fix.
How long should my YouTube hook be?
Between 8 and 15 seconds is optimal for most niches. Any shorter and there isn't enough space to plant a curiosity gap; any longer and the hook itself begins to feel like a preamble. The goal is a hook long enough to be specific and short enough to feel urgent.
Should I put my intro animation at the start?
No. Intro animations reliably cost 5–15 retention points because they delay the promise and signal "housekeeping" to the viewer. If you must include a branded animation, place it at the 30–45 second mark, after the initial promise has landed.
Conclusion
A flat retention curve is one of the most demoralizing sights in YouTube analytics. It looks final. It looks like the audience has passed judgment. But the graph is almost never a judgment on your channel or your ideas — it is a judgment on a specific handful of script beats, and those beats are rewritable.
In this case study, a single tutorial moved from a 22% average retention flatline to a 61% average retention rising curve. Nothing about the creator changed. Nothing about the production changed. What changed was the opening 15 seconds, two structural beats in the middle, and the staggering of three curiosity loops across the ten-minute runtime. The upside — a 375% lift in subscriber conversion and a doubling of click-through rate — was compounded by the algorithm, not manufactured by it.
If there is one takeaway to leave this article with, it is this: retention is a script problem, not a talent problem, and script problems are solvable. Pick your worst-performing video. Pull the curve. Identify the two darkest beats on the drop-off heatmap. Rewrite them using the RISE loop. Republish, measure, and repeat. Do that four times and your channel will not look the same.
When you are ready to run this loop faster than you can do it by hand, RetentionYT is built for exactly this workflow. But the framework belongs to you regardless of whether you use the tool — the graph, the heatmap, the rewrite, the re-measure. That loop, run consistently, is how flat retention curves become rising ones.
DO
About Daniel Ortega
Daniel is Head of Creator Research at RetentionYT. He has spent the last six years dissecting YouTube retention data across more than 12,000 videos in education, tech, gaming, and lifestyle niches. Before RetentionYT he led editorial strategy at two mid-market creator studios and consulted for channels with a combined 42 million subscribers.
Further Reading
- The Anatomy of a Perfect YouTube Hook — a companion guide focused entirely on the first 15 seconds.
- Curiosity Loops Explained: The Retention Device Every Creator Should Master.
- How to Read Your YouTube Retention Graph Like a Pro.
- YouTube Help — Audience retention report (official documentation).
- YouTube Creator Academy — platform-native fundamentals.
Frequently asked questions
- What is a flat retention curve on YouTube?
- A flat retention curve is a viewer retention graph that drops sharply at the start of a video and then continues to decline steadily without recovery. It indicates a weak hook, poor pacing, or a script that fails to renew curiosity, meaning most viewers leave before the payoff.
- How do you turn a flat retention curve into a rising one?
- Rewrite the first 15 seconds with a clear promise and curiosity gap, remove tangents, add a pattern interrupt every 15–30 seconds, layer curiosity loops every 60–90 seconds, and end with a payoff that triggers re-watches. These changes flatten the initial drop and create the upward spikes typical of a rising curve.
- What is a good average view duration on YouTube?
- For most YouTube niches, an average view duration of 50% or higher of total video length is considered strong. Videos under four minutes should target 60%+, while long-form 10–20 minute videos generally perform well at 45–55% average view duration.
- Why do viewers stop watching my YouTube videos?
- Viewers leave because the hook does not deliver on the thumbnail's promise, the script drifts into tangents, pacing becomes monotonous, or the video lacks curiosity loops. Analyzing the drop-off points in your retention graph reveals which of these leaks are hurting watch time.
- Does audience retention affect YouTube ranking?
- Yes. YouTube's algorithm heavily weighs audience retention and total watch time when deciding which videos to recommend. Higher retention signals viewer satisfaction, which directly increases impressions, suggested-video placement, and long-term channel growth.
- How often should I check my YouTube retention graph?
- Review your retention curve within 48 hours of publishing to spot early leaks, then again at the 7-day and 28-day marks to see how the video performs after the recommendation algorithm has fully evaluated it.
- Can editing alone fix a flat retention curve?
- Editing improves pacing and pattern interrupts, but it cannot fix a structurally weak script. If the underlying story lacks a clear promise, curiosity loop, and payoff, editing will only slow the decline. Script rewriting is the highest-leverage fix.
Find your video’s drop-off points before you publish
RetentionYT audits your script for the moments viewers leave — so you can fix them before recording.
Get retention tips in your inbox
Occasional, practical emails on hooks, pacing, and retention. No spam.
Related posts
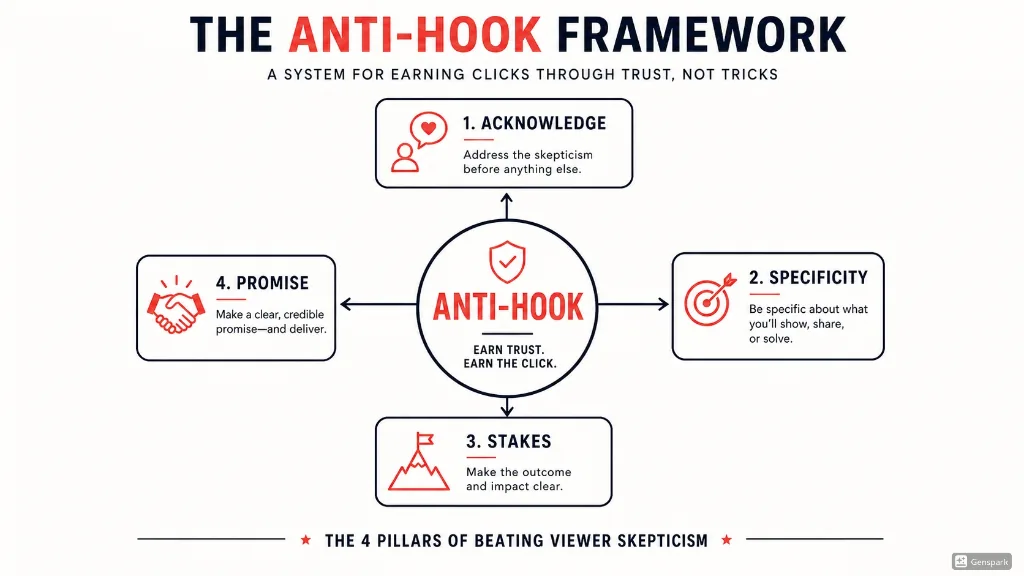
The Anti-Hook: How to Beat Viewer Skepticism in 10 Seconds
Learn the Anti-Hook framework — a proven system for beating YouTube viewer skepticism in the first 10 seconds. Frameworks, scripts, examples, and templates from RetentionYT.
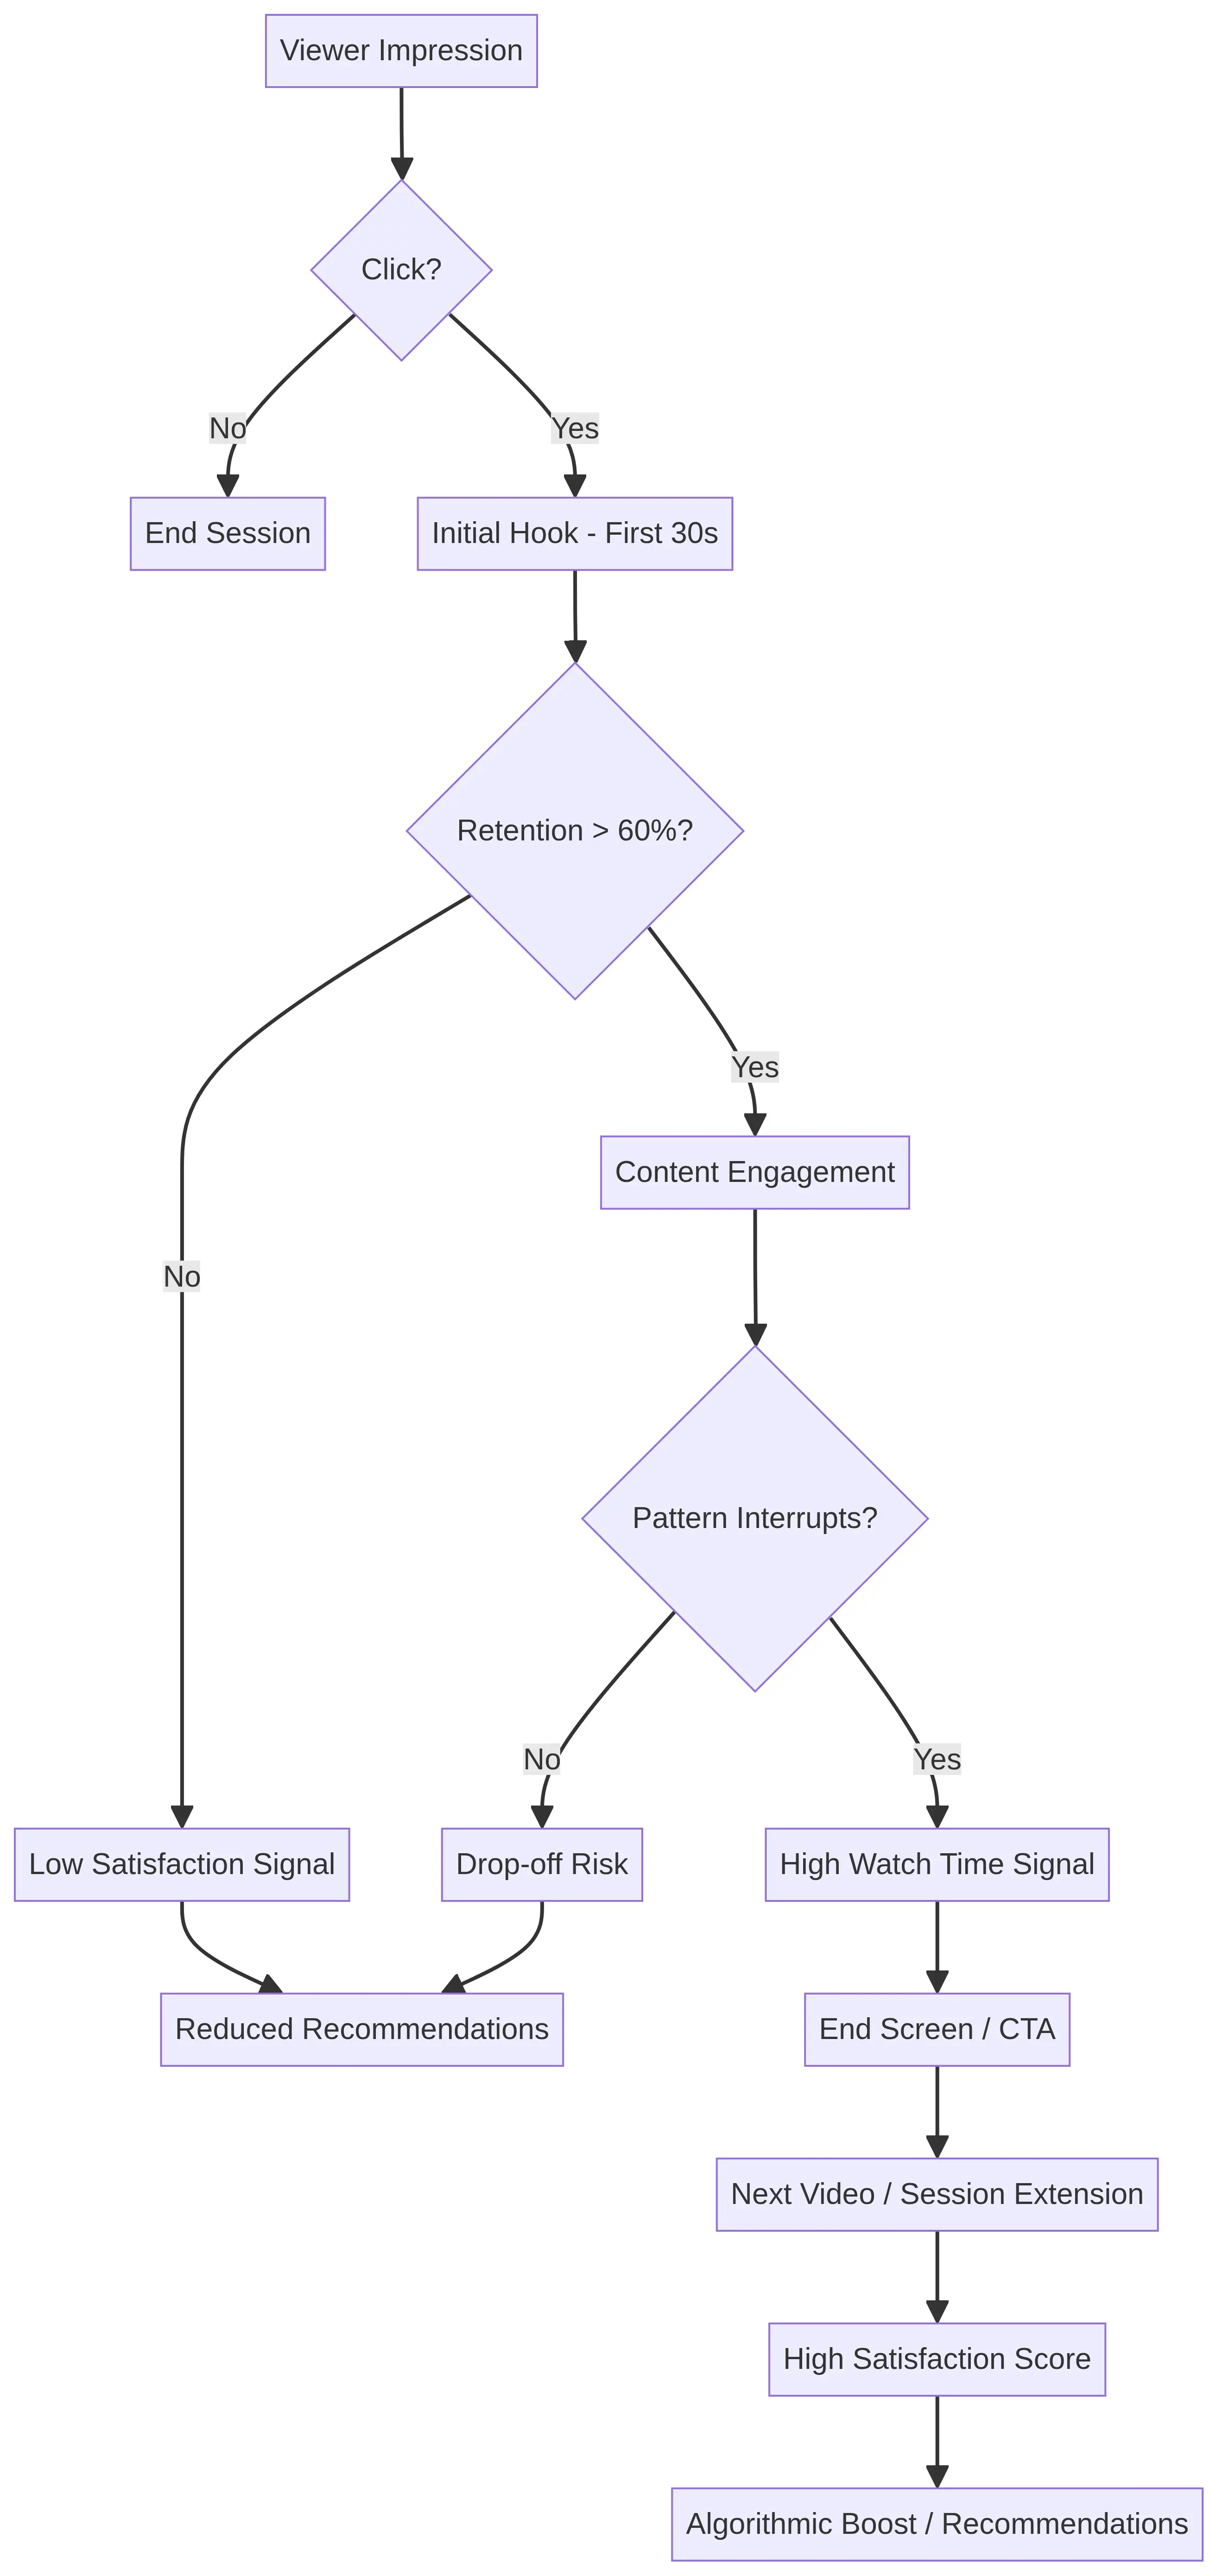
How to Get More Views on YouTube (the Retention-First Way)
Stop chasing trends. Learn how to get more views on YouTube by focusing on audience retention. Discover the algorithm secrets and practical strategies for growth in 2026.
Should You Script YouTube Shorts? Retention on Short-Form, One Second at a Time
On Shorts, the first second decides everything. Learn the exact scripting frameworks, retention data, and templates top creators use to beat the swipe and win the Shorts feed.